If you've got any cash on the sidelines, now would be a great time to put it to work.
Seasonal influences are particularly strong for U.S. equity markets from November through to June following mid-term U.S. elections. Since 1950, the S&P 500 Index has averaged gains of 17.96 per cent from the start of November of a mid-term election year through to the end of June of the following year. The approximately three quarter period offers the best string of quarterly gains in the 16 quarter presidential election cycle, beating the average gain during any given year by 7.5 per cent.

The large cap benchmark has yet to record a loss during this quarterly advance leading into the mid-point of the pre-election year, the period when the race for the next president gets underway. Strength is related to the end of uncertainty following negative political rhetoric during the mid-term election process and anticipation of an improving political atmosphere in Washington after the elections are over. Mid-term elections this year are on Tuesday Nov. 4.

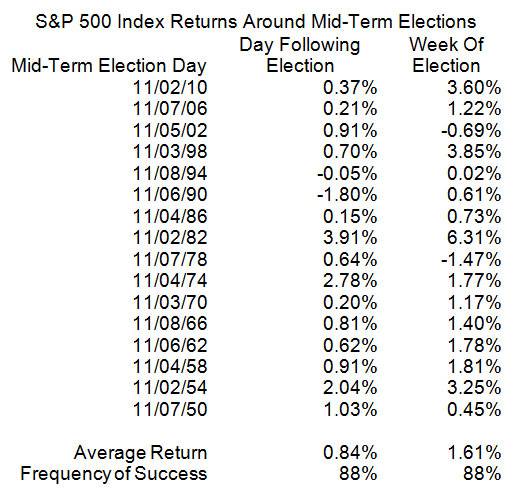
Strength in the S&P 500 Index has been particularly strong on the day and week after the elections. The large cap benchmark has averaged a gain of 1.61 per cent during mid-term election weeks dating back almost 65 years. The gain on the week was fueled by a strong reaction during the session that followed the election itself with the S&P 500 averaging a return of 0.84 per cent. Both the session following and the week of the election recorded gains in 88 per cent of periods since 1950. Below is a study recently published at www.equityclock.com
What about this year?
The main battle during the mid-term election this year is for control of the Senate and its agenda. Democrats currently have control, but Republicans can obtain control of the Senate by winning six seats from the Democrats. Many seats are highly contested, and recent polls suggest that the Republicans will win 6- to 8-seats from the Democrats. That sets the stage for a political agenda that will lean more to the right of the political spectrum after the election, a favourable scenario for U.S. equity markets.
History suggests that a Republican controlled House and Senate is very bullish for equity markets in the U.S. The S&P 500 Index has averaged a gain of 27.35 per cent per term under Republican control, surpassing the results of all other compositions of Congress since 1950. As well, some of the best returns that the U.S. equity market has seen over the last 65 years have come during periods when the Republican controlled House and Senate are accompanied by a Democratic President. During the 104th through the 106th session of Congress from 1995 through 2000, the S&P 500 Index averaged a gain per term of 44.88 per cent, exceeding the returns of any other any other composition of government dating back to 1950. With the Fed's quantitative easing program now complete, investors will be looking for the leadership from Congress to set the stage for an environment that is conducive to sustained economic expansion and continued earnings growth.
Technical profile
The S&P 500 Index is following its historic pattern during a mid-term U.S. election year. It reached an intermediate low on schedule on October 15 and has traded higher since. Short term momentum indicators (Stochastics, RSI and MACD) are pointing higher.
The low in mid-October in a U.S. mid-term U.S. election year is important for another reason. It traditionally marks the bottom of the four year presidential cycle.
Investment opportunity
It's not too late to "buy the market" despite recent gains. The period of seasonal strength is just starting. Purchases on short-term weakness are preferred. A wide variety of exchange traded funds are available that track the S&P 500 Index. The most actively traded ETF in the world is S&P 500 SPDRs (SPY). Canadian investors also can choose to invest in the S&P 500 Index in Canadian Dollars. Choices include Horizons S&P 500 ETF (HXS), BMO S&P Index ETF (ZSP) and iShares Core S&P 500 Index ETF (XSP).
Disclaimer: Comments, charts and opinions offered in this report by http://TimingTheMarket.ca and http://EquityClock.com are for information only. They should not be considered as advice to purchase or to sell mentioned securities. Data offered in this report is believed to be accurate, but is not guaranteed. Don and Jon Vialoux are Research Analysts with Horizons ETFs Management (Canada) Inc. All of the views expressed herein are the personal views of the authors and are not necessarily the views of Horizons ETFs Investment Management (Canada) Inc., although any of the recommendations found herein may be reflected in positions or transactions in the various client portfolios managed by Horizons ETFs Investment Management (Canada) Inc.