The S&P/TSX Composite Index was almost exactly flat for the week ending with Thursday's close with a gain of less than 0.1 per cent. The domestic equity benchmark stands 7.9 per cent higher year to date and according to Relative Strength Index (RSI), it's hovering just below the sell signal of 70 with a reading of 67.0.
There are currently four stocks trading in technically attractive, oversold territory with an RSI reading below the buy signal of 30: DH Corp., Constellation Software Inc., Jean Coutu Group Inc., and Cogeco Communications. None of them, however, are trading above their 200 day moving average. As we've seen numerous times over the past 18 months, RSI buy signals work less well when stocks prices are below the 200 day moving average that represents the longer term performance trend.
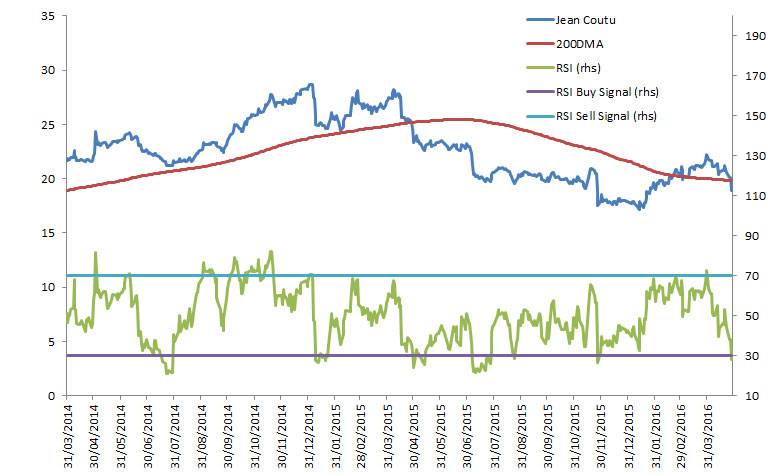
I picked Jean Coutu for the focus chart this week because it only recently knifed through its trend line, and the current remains within one dollar of the 200-day moving average.
In a pattern similar to many stocks we've looked at in the past few months, the past two years have seen RSI buy signals work well for Jean Coutu stock when it was trading above the 200-day and not very well when it fell below. RSI buy signals provided profitable entry points in July 2014 and January 2015. But, after the stock went through the 200-day in April 2015, buy signals in July, August and November of that year only marked pauses in selling pressure.
Jean Coutu is an interesting stock to watch, but it won't be fully attractive in a technical sense until it regains the 200-day moving average. The domestic market, as a whole, has had a good run, I noted above how close the S&P/TSX Composite is to overbought conditions, and might be due for a pause that would see Jean Coutu fall further below the 200-day moving average.
The list of S&P/TSX Composite stocks trading in overbought, technically vulnerable territory is still sizeable at 21 members. Interestingly, 11 of these companies have a forward price earnings ratio of 'N/A" according to Bloomberg data, which means that have either operated at a loss over the past twelve months, or are expected to lose money in the next year. This suggests we've seen a "relief rally" in Canadian stocks – companies thought to be in danger of bankruptcy are now more stable.
As always, technical analysis is a valuable tool, but investors should complete fundamental research before making any market transactions.
Follow Scott Barlow on Twitter @SBarlow_ROB.
