The S&P/TSX Composite had a terrific week, jumping 1.7 per cent as of Thursday's close. The benchmark is now, however, closing in on overbought technically-vulnerable territory with a Relative Strength Index (RSI) reading of 65 that is just below the RSI sell signal of 70.
There are only six oversold benchmark constituents trading with RSI levels below the buy signal of 30. Hudson's Bay Co. is the most oversold stock in the index (investors are clearly not in a holiday mood yet) followed by Guyana Goldfields Inc. The REIT sector continues to struggle with rising bond yields – Boardwalk REIT, Allied Properties REIT and Smart REIT are also on the oversold list.
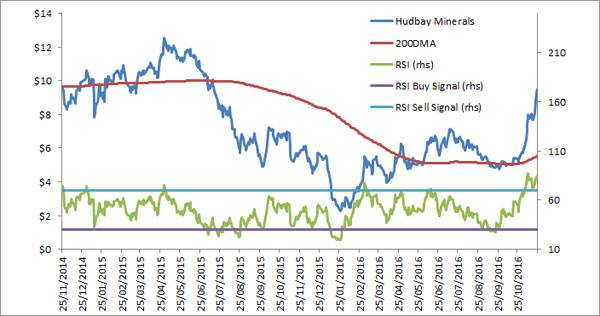
I picked an overbought, not oversold stock as the focus chart this week. HudBay Minerals Inc. is the most technically extended stock on the overbought list – its RSI is sky high at 84.6 - as copper prices continue to surge higher. The miner jumped 23.4 per cent in the past week (that's not a typo), so we'll look at the stock's two-year performance history in attempt to estimate how much of a warning sign this is.
RSI sell signals have worked well in the past two years, and this implies that active investors should consider taking at least some profits after the recent rally. A December 2014 sell signal was followed by a 22-per-cent decline to Jan. 14 2015, although admittedly the stock price did recover shortly thereafter. Investors that ignored the RSI sell signal at the beginning of May 2015 were nowhere near as fortunate. HudBay began a slide directly after that would see the stock decline 61 per cent to the end of September. Sell signals in March and June of this year also predicted significant declines.
It is possible that we've entered a new era of inflation and U.S. economic growth that will see cyclical sectors like copper miners continue higher. I would suggest that, at the very least, investors avoid buying more Hudbay until the RSI falls below the sell signal of 70.
Technical analysis should always take a back seat to fundamental analysis and investors should always complete fundamental research before buying or selling any investment .
Follow Scott Barlow on Twitter @SBarlow_ROB.
TSX overbought and oversold stocks
| Oversold | Name | RSI | Price | 200DMA | Return 1W % | Return YTD % | PE Ratio TTM | PE Ratio Fwd |
|---|
| HBC-T | Hudson's Bay Co | 22.19118 | 14.04 | 16.5069 | -3.703703 | -21.72023 | #N/A N/A | #N/A N/A |
|---|
| GUY-T | Guyana Goldfields Inc. | 26.82177 | 5.57 | 7.33715 | -6.386549 | 80.84416 | 32.83609483 | 11.27886973 |
|---|
| BEI.UN-T | Boardwalk Real Estate Invest | 27.92172 | 43.86 | 51.7626 | 1.1065 | -4.124027 | 15.71382939 | #N/A N/A |
|---|
| AP.UN-T | Allied Properties Real Estate | 28.81461 | 33 | 36.14375 | -0.3021102 | 8.251745 | 19.26525808 | #N/A N/A |
|---|
| SRU.UN-T | Smart Real Estate Investment | 29.2523 | 30.31 | 34.6291 | 0.9323968 | 4.519061 | 18.12089132 | #N/A N/A |
|---|
| THO-T | Tahoe Resources Inc. | 29.9789 | 12.55 | 16.38815 | -3.757667 | 6.906748 | 13.75311271 | 11.83348462 |
|---|
| | | | | | | | |
|---|
| Overbought | Name | RSI 14D | Px last | MOV_AVG_200D | LAST_CLOSE_TRR_1WK | LAST_CLOSE_TRR_YTD | PE_RATIO | BEST_PE_RATIO |
|---|
| HBM-T | HudBay Minerals Inc. | 84.58894 | 9.49 | 5.5389 | 23.40702 | 79.39291 | #N/A N/A | 29.67627162 |
|---|
| SLF-T | Sun Life Financial Inc. | 82.90155 | 53.38 | 42.9852 | 3.529867 | 27.24828 | 13.8541471 | 13.16074951 |
|---|
| TCK.B-T | Teck Resources Ltd. | 81.90558 | 35.02 | 17.7455 | 11.35135 | 558.0268 | 109.1407749 | 8.485582748 |
|---|
| LB-T | Laurentian Bank of Canada | 80.34743 | 53.51 | 48.9946 | 4.532135 | 14.87834 | 9.508057652 | 9.335310537 |
|---|
| MFC-T | Manulife Financial Corp. | 80.20656 | 23.51 | 18.4979 | 3.355927 | 17.93367 | 15.1758979 | 11.25957854 |
|---|
| RY-T | Royal Bank of Canada | 79.40816 | 89.65 | 78.6435 | 3.247725 | 26.05263 | 13.20358642 | 12.76520006 |
|---|
| TD-T | Toronto-Dominion Bank | 78.86654 | 64.13 | 56.861 | 2.199199 | 22.94575 | 13.75686309 | 12.76218905 |
|---|
| TFI-T | Transforce Inc. | 78.62411 | 33.87 | 25.13815 | 2.854536 | 46.52238 | 23.55597025 | 14.35777872 |
|---|
| WSP-T | WSP Global Inc. | 77.6918 | 48.36 | 41.04145 | 1.404911 | 17.09479 | 25.13075977 | 18.75145405 |
|---|
| CWB-T | Canadian Western Bank | 77.6736 | 29.22 | 25.18825 | 8.342603 | 28.48724 | 12.75910071 | 12.02469136 |
|---|
| STN-T | Stantec Inc. | 75.7605 | 36.12 | 31.7387 | 4.453433 | 6.377558 | 26.59145594 | 17.87234043 |
|---|
| TRQ-T | Turquoise Hill Resources Ltd. | 75.73496 | 4.92 | 3.891 | 9.82143 | 40.17094 | 22.92080158 | #N/A N/A |
|---|
| LUN-T | Lundin Mining Corp. | 75.63277 | 7.07 | 4.7706 | 11.16352 | 86.05264 | #N/A N/A | 83.17069591 |
|---|
| LIF-T | Labrador Iron Ore Royalty Co. | 75.57796 | 17.61 | 13.14415 | 7.247262 | 94.98637 | 22.57692386 | 14.25910931 |
|---|
| TRI-T | Thomson Reuters Corp. | 75.54314 | 57.76 | 53.25405 | 2.04947 | 14.03415 | 26.77895212 | 18.94970374 |
|---|
| FM-T | First Quantum Minerals Ltd. | 75.12827 | 16.67 | 9.57625 | 16.00557 | 222.456 | 26.42952942 | 30.73272131 |
|---|
| ONEX-T | Onex Corp. | 74.96559 | 93.34 | 80.5431 | 2.853991 | 10.39755 | #N/A N/A | 1383.532174 |
|---|
| IAG-T | Industrial Alliance Insurance | 74.81815 | 57.04 | 43.69435 | 2.534603 | 33.04236 | 15.21066691 | 11.82421227 |
|---|
| EFX-T | Enerflex Ltd. | 74.1745 | 16.72 | 11.9981 | 5.025121 | 29.42087 | 36.14103502 | 17.71186441 |
|---|
| CM-T | Canadian Imperial Bank of Commerce | 74.12096 | 105.3 | 99.3464 | 1.739133 | 19.71936 | 10.91793529 | 10.58504222 |
|---|
| PWF-T | Power Financial Corp. | 74.05229 | 33.54 | 31.165 | 2.820362 | 9.598714 | 11.82251456 | 10.87548638 |
|---|
| ECA-T | Encanada Corp. | 73.9215 | 16.63 | 10.59295 | 8.621807 | 138.0031 | 46.34536838 | 73.8018501 |
|---|
| NA-T | National Bank of Canada | 73.9138 | 49.81 | 44.44505 | 2.384378 | 28.18288 | 11.7715375 | 10.18817754 |
|---|
| DSG-T | Descartes Systems Group | 73.45869 | 30.34 | 25.84035 | 0.0989795 | 8.979886 | 72.98440042 | 23.84489172 |
|---|
| RBA-T | Ritchie Bros. Auctioneers | 72.7342 | 51.29 | 40.9845 | 3.14204 | 57.16174 | 32.84178738 | 28.58067813 |
|---|
| GWO-T | Great-West Lifeco Inc. | 72.15114 | 35.31 | 34.0161 | 2.496373 | 5.432019 | 13.16123514 | 12.62424026 |
|---|
| ERF-T | Enerplus Corp. | 71.64069 | 10.97 | 7.51515 | 11.25761 | 137.0141 | #N/A N/A | 31.52298851 |
|---|
| CTC.A-T | Canadian Tire Corp. | 71.46484 | 142.36 | 135.701 | 1.388788 | 22.66037 | 16.47078976 | 14.67326324 |
|---|
| BMO-T | Bank of Montreal | 70.86938 | 88.8 | 82.45525 | 1.369868 | 18.56874 | 12.41810978 | 11.97088164 |
|---|
|
|---|
Source: Bloomberg/Scott Barlow
