Hello Lou
Thanks for your insights, very informative.
I would like your take on Home Capital Group Inc.
Thanks again for your time.
Andy
_____
Hey Andy,
Thanks for the assignment and your kind words. I'm glad that you are making use of the analysis. This will be the first time that I examine the charts for Home Capital Group Inc. (HCG TSX). The company provides residential and non residential mortgages as well as consumer loans. The company had to sever relations with 45 mortgage brokers who were alleged to be playing fast and loose with applications. The brokers were said to be failing to accurately verifying the income of applicants which compromises the quality of the loan. In the parlance of the U.S. subprime mortgage debacle these were called Liars Loans.
From the research conducted the mortgage origination process as practiced by the 45 brokers may have been flawed but the potential for loan losses has been evaluated by some analyst as minimal. Of greater concern is the volume of loans that the severed brokers originated historically and how the company will replace them with higher quality applications.
In addition you should be aware that short sellers have been hunting HCG since last year and their evaluation has proven correct.
A probe of the charts will help identify the trend, support, and resistance associated with this stock.

The three-year chart illustrates a reversal of the uptrend that started in July of 2013 when the shares were trading near $25.00. The advance reached a 52-week high of $55.72 by August of 2014 when the MACD and the RSI generated sell signals. The stock broke below the uptrend line by early September and a death cross formed in January of 2015 where the selling gained traction.
The gap down in July of 2015 was in reaction to the news that the company experienced lower mortgage origination in Q2 and the termination of some of their brokerage relations.
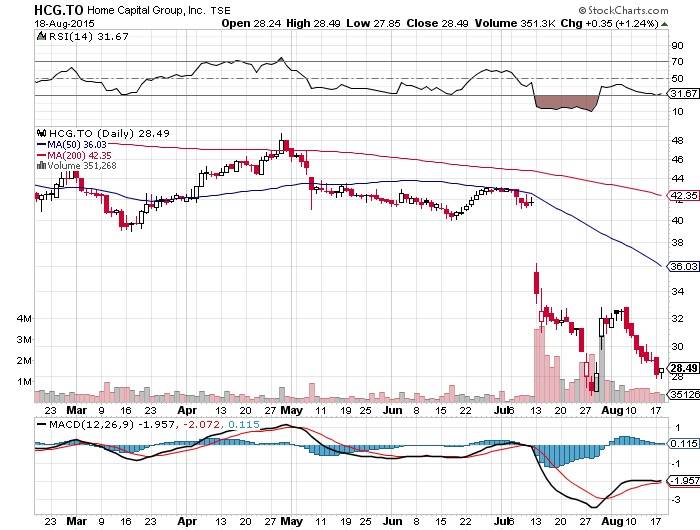
The six-month chart highlights the resistance along the 50 and 200-day moving average and the stock trying to hold support along $27.50. The pop in late July came as buyers reacted to the opportunity to exploit an an oversold position. However the advance was short lived and it appears that a retest of $27.50 is in the offing.
There isn't sufficient evidence that we can expect a trend reversal in the near term.
Next time I will inspect the charts for Calfrac Well Services Ltd. (CFW TSX) for Gordon.
Make it a profitable day and happy capitalism!
Have your own question for Lou? Send it to lou@happycapitalism.com.
Editor's note: In an earlier version of this article, the 52-week high was incorrectly stated as August of 2015. In fact, it was 2014. This version has been corrected.