Dear Lou,
Would you be so kind to give your advice on the main investment groups and give the top two or three corporations an investor should own. e.g. Energy ( Husky,Imperial Oil ?) Communications ( BCE, Rogers?) Financials, etc. etc.
Thank you,
Garry
---
Hey Garry,
I will undertake the challenge of this long-term assignment with the caveat that I will address other requests as they come in to avoid crowding out other readers and listeners. Lets begin with Husky Energy Inc.. This will be the fifth time since 2010 that I investigate the situation at HSE. The last time was on Feb. 6 when the shares were trading for $28.13. Paul had tasked me with conducting a comparative analysis of three energy stocks to identify the pick of the litter.
The analysis identified that the stock was meeting resistance at $29 and the next flex point that could move the stock would be the release of Q4 results on Feb. 12. Unfortunately, the financials were not encouraging given the struggle to overcome weak energy prices.
Another run at the charts will help identify how best to proceed with HSE.

The three-year chart for the S&P TSX Capped Energy Index indicates that the sector as a whole has been under pressure since June of 2014. From the December 2014 lows, the index has been trading in an up channel and needs to break above resistance at 240 and the 200-day moving average to continue the advance.

The three-year chart for HSE illustrates trading in a gentle down channel since February. The moving average convergence divergence (MACD) and the relative strength index (RSI) have generated buy and sell signals over the last three months for those investors attuned to the patterns.
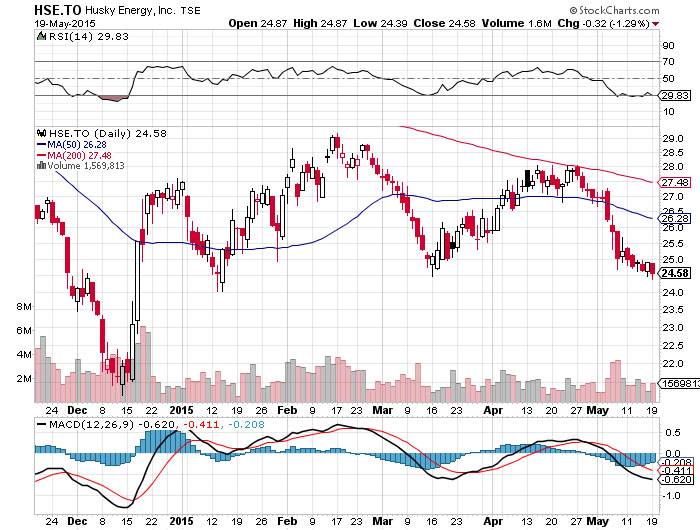
The six-month chart highlights the resistance along the 200-day moving average that saw the stock pullback in April. The chart also provides a close up of the buy and sell signals generated by the MACD and the RSI since the last analysis published in early February.
HSE will report Q2 in July and the dividend yield is currently 4.88 per cent. It would be worth examining other members of the Energy Index to see the other options in this beaten-down sector. The current profile for HSE would indicate that investors would be best served trading this stock for profits.
Next time I will probe the charts for Imperial Oil Ltd..
Make it a profitable day and happy capitalism!
Have your own question for Lou? Send it in to lou@happycapitalism.com.