Today's probe of the charts for St. Jude Medical Inc. will conclude the assignment from Terry. The company was formed in 1976 and is focused on developing cost effective medical technologies that improve patient care. The company sells in over 100 countries, employs over 16,000 staff, and invests 12 per cent of revenue on research and development.
The treatment areas addressed by STJ's technologies include heart failure in addition to other cardiac disorders, vascular disease, chronic pain, and movement problems. These conditions are some of the most expensive to treat which has helped drive market acceptance. The stock hit a 52-week high on April 22 as it reported better than expected Q1 results. The company's atrial fibrillation business was cited as a growth driver, but U.S. dollar strength produced a drag on their international sales.
A run of the charts will provide added depth for your consideration.
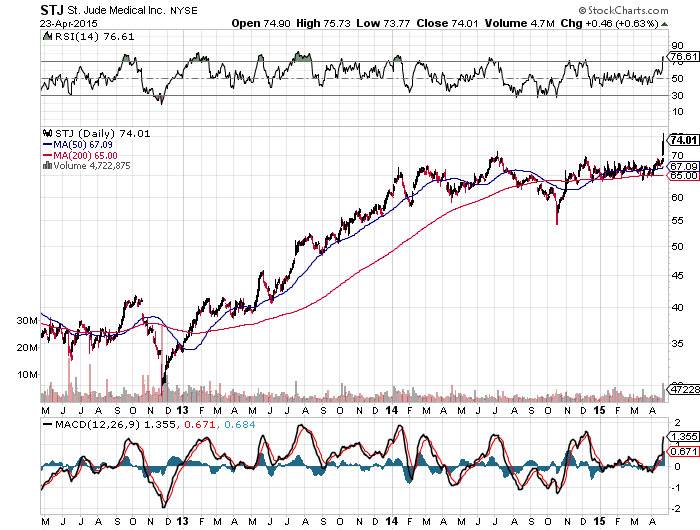
The three-year chart indicates that the shares had been meeting resistance at $70 since June of 2014. It's worth noting the sell signals generated by the MACD and the RSI in June of last year as the shares pulled back to a 52-week low of $54.80 by October. From there, the momentum indicators signalled a buy sending the stock back to resistance at $70 by December.
For the first four months of 2015, STJ traded in a tight range with support at $65 and resistance at $68. The MACD and the RSI signalled a buy in early April that led to the break above $70.00.

The six-month chart highlights the tight range that dominated trading for most of this year and the buy signals as we came into April. The move from $65 to the 52-week high in less than a month has been very profitable for investors who caught the ride.
The question at this point is if this move can develop into a new sustained uptrend. The shares are currently just slightly overbought, but there are no signs that we have run out of buyers.
Next time I'll examine the charts related to Fortis Inc. on an assignment from Tom.
Make it a profitable day and happy capitalism!
Have your own question for Lou? Send it in to lou@happycapitalism.com.