
Illustration by ©2023 Brian Stauffer
After three years of COVID-19-fuelled turmoil and uncertainty, Canada’s economy is at an inflection point. With interest rates at their highest level in 15 years as the Bank of Canada fights inflation rates not seen since the 1980s, Canadians are trying to make sense of what lies ahead: Does Canada face a recession? How sharp will the slowdown be? Will inflation cool or remain stubbornly high?
To help make sense of the year ahead, The Globe and Mail asked dozens of experts – including economists, investors, academics and business leaders – to each select a chart that reflects an issue they think will be critical to watch in 2023 and explain its importance.
The charts they selected reflect a broad range of metrics that cover everything from housing and interest rates and inflation to job markets, Canada’s energy transition, immigration and Indigenous reconciliation.
The shock and awe 2023: global market rebound approaching
The Decibel: Disaster-proof your finances for 2023
INFLATION AND INTEREST RATES
Divergent debt
Beata Caranci, chief economist, TD Bank Group (@TD_Economics)
One word describes this graph: striking. The painful U.S. deleveraging cycle after the 2008-09 global financial crisis now pays dividends, and it could be a factor that creates American consumer resilience relative to the size of interest rate changes.
Canadians are unlikely to say the same. The differences in household debt-service ratios between the two countries reflect differences in the amount of leverage and the structure of mortgage debt. American mortgage holders are skewed to a 30-year fixed rate that helps insulate them from renewal risks, while Canadians usually renew at five-year intervals or less.
This risk is amplified by the popularity of variable-rate mortgages here during the pandemic. These terms climbed to 34 per cent of the overall stock of Canadian mortgage credit, compared to a previous peak of 25 per cent in 2018.
The Canadian debt-service ratio rises in this graph solely because of interest rate increases, and despite our assumptions that loan growth stalls and households extend their mortgage amortization to minimize the increase in monthly payments.
Not-so-great expectations
Brett House is a professor of professional practice in economics at Columbia Business School and a Fellow with the Public Policy Forum (@BrettEHouse)
Businesses and consumers surveyed by the Bank of Canada in the third quarter of 2022 expected the cost of living over the next two years to keep rising by 5.2 per cent and 4.3 per cent year-over-year, respectively. Inflation expectations matter because they drive wage and price contracts that will remain in effect long after supply chain bottlenecks and war-related commodity-market disruptions have receded.
Although headline inflation readings have come down from their peak last June, average annual wage growth in November was running at 5.6 per cent. That’s fast enough to sustain inflation because those pay gains were much quicker than Canada’s productivity growth rate. The central bank’s governing council signalled at its Dec. 7 meeting that it was nearing the end of its interest rate hiking cycle, but it won’t be finished raising rates until what it called “elevated” inflation expectations are nearer to the bank’s 2-per-cent objective.
Bond markets are anticipating that the bank will do whatever is necessary to get inflation back to its target range of 1 per cent to 3 per cent over several years. Unless inflation expectations have come down substantially, that’ll mean another rate increase in 2023.
Amplified pain
David Doyle, head of economics, Macquarie Group
A year ago, markets were discounting 125 to 150 basis points in interest rate increases in 2022 by the Bank of Canada. The bank has more than delivered this, raising rates by 400 basis points in 2022, or four percentage points, the sharpest year of increases on record.
All rate hikes, however, are not created equal. Given rising leverage in the private sector, rate increases in 2022 should have more impact than in the past. Accounting for this puts the 2022 rate cycle in its proper perspective. On this debt-adjusted basis, the rate hikes were more than twice as severe as the next most dramatic year of rate hikes (1980).
Significant economic consequences are already flowing from this. The unemployment rate bottomed in the summer and has begun to move upward. In the third quarter, final domestic demand contracted, dragged down by residential investment and consumer spending. These developments foreshadow a recession ahead.
Our forecast for Canada in 2023 remains the same as it has since April, 2022. We expect a severe recession, with real GDP contracting by 3 per cent, double the decline we anticipate in the United States.
Are we there yet?
Arlene Kish, director, economics, S&P Global Market Intelligence
After seven interest rate increases by the Bank of Canada, the big question is: When will consumers get a break on prices? The short answer: eventually. About 7.6 per cent of the items that make up the consumer price basket have prices that are increasing within the Bank of Canada’s target year-over-year inflation range of 1 to 3 per cent.
Prices for most items, outside of food and energy, are rising by more than 5 per cent from a year ago. Gasoline prices are the biggest contributor to annual inflation, but the recent drop in prices is providing some relief to consumers. Some price pressures are hard to control, given that Canada imports many goods households purchase, such as food. Plus, labour shortages continue to push wage inflation higher, leading to rising input costs for goods and services.
Overall, inflation barely budged from August through to November, yet core inflation is quickening.
The Bank of Canada’s governing council has more work to do as it remains “resolute” in bringing inflation back to the bank’s target. Anticipate at least one more 25-basis-point interest rate increase in January, followed by a neutral stance throughout 2023 as the total cumulative impact permeates the economy, removing excess demand and softening inflation.
The long and short of inflation
Pierre Cléroux, chief economist, Business Development Bank of Canada (@PierreCleroux)
Inflation soared to multidecade highs in 2022, forcing the Bank of Canada to tighten monetary policy rapidly and aggressively. The central bank is closely watching inflation to better determine its next move, and so should we.
Headline inflation in Canada peaked at 8.1 per cent in June, 2022, and has declined to 6.8 per cent in November. While the recent number is well above the bank’s 2-per-cent target, the shorter-term trend demonstrated by the three-month annualized change had been encouraging before an upswing in the fall.
Therefore, it is important to watch inflation to get an indication on the direction of interest rates.
Historic red flag
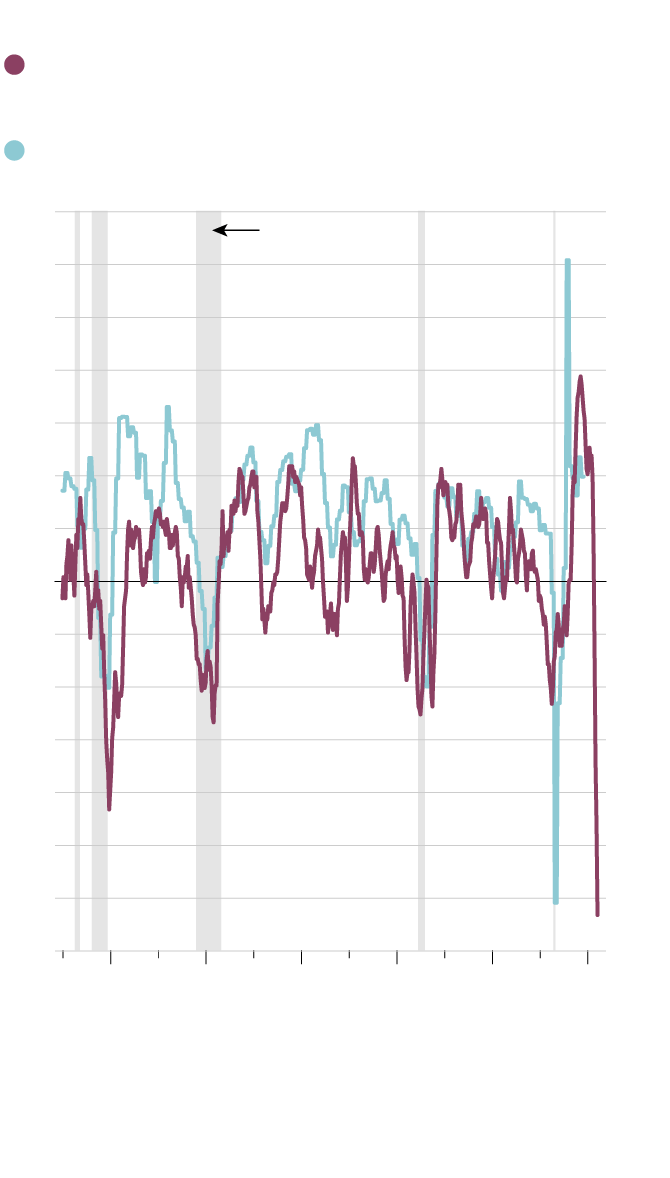
David Wolf, portfolio manager, Fidelity Investments Canada
After interest rates go up, the economy tends to fall down. This chart shows the rate of change in real mortgage interest costs compared with the performance of the economy over the subsequent year. (The axis on the chart for interest costs is inverted in order to show how reliably rising interest rates precede economic slowdowns.)

Interest rates and economic growth
Left axis: Real mortgage interest costs (6-month
change, axis inverted, advanced one year)
Right axis: Real GDP (year-over-year change)
14%
-14%
Grey areas indicate
recession periods
12
-12
10
-10
8
-8
6
-6
4
-4
2
-2
0
0
-2
2
-4
4
-6
6
-8
8
-10
10
-12
12
-14
14
1983
1991
1999
2007
2015
2023
Note: Real mortgage interest costs = CPI for mortgage
interest cost deflated by total CPI.
THE GLOBE AND MAIL, SOURCES: STATISTICS
CANADA, HAVER ANALYTICS, C.D. HOWE INSTITUTE,
FMR (CANADA)
Interest rates and economic growth
Left axis: Real mortgage interest costs (6-month
change, axis inverted, advanced one year)
Right axis: Real GDP (year-over-year change)
14%
-14%
Grey areas indicate
recession periods
12
-12
10
-10
8
-8
6
-6
4
-4
2
-2
0
0
-2
2
-4
4
-6
6
-8
8
-10
10
-12
12
-14
14
1983
1991
1999
2007
2015
2023
Note: Real mortgage interest costs = CPI for mortgage
interest cost deflated by total CPI.
THE GLOBE AND MAIL, SOURCES: STATISTICS CANADA,
HAVER ANALYTICS, C.D. HOWE INSTITUTE, FMR (CANADA)

Interest rates and economic growth
Left axis: Real mortgage interest costs (6-month change, axis inverted, advanced one year)
Right axis: Real GDP (year-over-year change)
-14%
14%
Grey areas indicate
recession periods
-12
12
-10
10
-8
8
-6
6
-4
4
-2
2
0
0
2
-2
4
-4
6
-6
8
-8
10
-10
12
-12
14
-14
1979
1983
1987
1991
1995
1999
2003
2007
2011
2015
2019
2023
Note: Real mortgage interest costs = CPI for mortgage interest cost deflated by total CPI.
THE GLOBE AND MAIL, SOURCES: STATISTICS CANADA, HAVER ANALYTICS, C.D. HOWE INSTITUTE, FMR (CANADA)
The historically sharp increase in interest rates through 2022 points to a historically deep recession in 2023. There are reasons to believe that it won’t be quite that bad. But the degree to which this leading relationship holds between rates and growth will tell the story of the Canadian economy in the coming year.
It’s a global thing
Siddhartha Bhattacharya, economist, ATB Financial (@sid_economist)
Right when recovery from the pandemic appeared on the horizon, things went into a tailspin with Russia’s invasion of Ukraine. As a result, prices for commodities such as crops, chemicals and natural gas soared to levels not seen in decades.
Global output, which the International Monetary Fund initially expected to increase by 3.8 per cent in 2023, underwent several downward revisions and is now pegged to grow by less than 3 per cent. While several factors can be cited for this, elevated inflation across most G7 nations and the measures adopted to combat it pose the biggest threat to economic health going into 2023. Looking ahead, it is crucial to see how effectively and quickly last year’s interest rate increases pull inflation toward a more normal range.
Mortgage borrowers in a fix
Royce Mendes, managing director and head of macro strategy, capital markets at Desjardins Securities (@RoyceCMendes)
Most Canadians know our economy is very sensitive to changes in interest rates. As evidence, the household debt-to-disposable-income ratio is often cited alongside the share of the economy devoted to housing. But the structure of the Canadian mortgage market deserves more attention, since it means the effects of higher interest rates are being felt sooner in Canada than in other jurisdictions.
While our neighbours to the south rely on 15-year and 30-year mortgages, most households here have historically opted for five-year fixed-rate products. So, in any given year, all else equal, there’s a greater share of Canadians renewing their mortgages than in the United States. Recently, there have also been even more households choosing variable-rate mortgages, in which the amount of interest owed adjusts as the Bank of Canada raises rates.
With central bankers hiking rates very aggressively, our simulations show that just about all of the variable-rate mortgages originated over the past two years now owe more interest than a buyer’s fixed regular payment covers. This is a situation that hasn’t been faced before. So, while monetary-policy makers continue to forecast a soft landing, it remains to be seen whether their models are adequately capturing all of the effects on the Canadian economy.
Unfavourable odds
Douglas Porter, chief economist, BMO Capital Markets
The U.S. Federal Reserve has boosted short-term interest rates by 425 basis points in less than a year, and the Fed is not done yet. In the postwar era, there have been only three other periods during which rates went up by at least 425 bps in a 12-month period: in 1973, in 1979-80 and in 1981. In each and every case, the U.S. economy was in a recession within a year. And, as the chart reveals, there were a number of cycles during which it took less than that to tip the economy over. Fundamentally, this is why the odds of a recession, even if it is shallow, are so high for 2023.
Momentary policy
Derek Holt, head of capital markets economics, Scotiabank
As Canadians grapple with the soaring cost of living and higher borrowing costs, one question looms prominently over the outlook: When will relief arrive? Markets are pricing in significant interest rate cuts starting in late 2023, and rate cuts of almost two percentage points by the end of 2024. Scotiabank Economics forecasts a cumulative 1.25 percentage points of Bank of Canada rate cuts by the end of 2024.
History may be at least somewhat on our side. Since the central bank adopted its current approach to setting rates in 1996, it has taken an average of about 14 months to begin cutting after the policy rate peaks. If you exclude the unique circumstances after the global financial crisis, that average period drops to just over half a year before cuts set in.
Today’s circumstances are unique – when and by how much rate relief may begin to arrive will be informed by uncertain developments – but bond markets are already beginning to price in this coming relief.
WORK AND WAGES
Ghost-town rebound
Stephen Tapp, chief economist, Canadian Chamber of Commerce (@stephen_tapp)
As Canada’s work force continues to adjust to a new equilibrium of hybrid and remote work, it’s proving to be the biggest labour-market adjustment of our lifetimes.
The Canadian Chamber of Commerce Business Data Lab recently released a report and interactive dashboard that shows workplace mobility has taken a significant hit in the downtowns of the largest cities, including Ottawa-Gatineau, Toronto, Edmonton, Calgary and Vancouver.
As maps in the report show, there’s evidence of a doughnut effect, in which traffic to the downtown cores of Canada’s biggest cities hollowed out, while action shifted to outlying, mid-sized commuter cities (such as Barrie, Brampton and Brantford in Ontario, Chilliwack, B.C., and Trois-Rivières) as knowledge workers embraced remote work and cheaper housing.
Thankfully, we saw progress in 2022, with downtown ghost towns slowly coming back to life with increasing vibrancy. How much more recovery will we see in 2023, and what will be the implications for local economies and businesses across Canada?
Beware the wage rage
Armine Yalnizyan, economist, Atkinson Fellow on The Future of Workers (@ArmineYalnizyan)
Inflation hit levels not seen in four decades last year, erasing purchasing power. We’re told that if workers try to recoup lost ground, they could trigger a wage-price spiral, baking in never-ending waves of wages trying to catch up with prices, which in turn rise because of higher costs. Nobody wants entrenched inflation. But is it happening?
I recently learned that wage growth is in the eye of the beholder – and data adjuster. Talking with another economist about inflation, I was told claims of wage growth falling behind inflation are “factually false.” Not only has wage growth kept up with inflation; it has been “explosive” since last year. The supporting evidence indexed changes to April, 2022, using three-month moving averages and in-house seasonally adjusted data (normally accompanied by the Statistics Canada caution, “Don’t try this at home, kids”).
Inflation is usually measured monthly as a year-over-year change. So is wage growth. Both are not typically seasonally adjusted. Do you see evidence that Canadian workers are keeping up with inflation in this graph? Keep your eyes out for wage growth and wage rage analysis in 2023.
Metrics of Reconciliation
Tabatha Bull, CEO, Canadian Council for Aboriginal Business (@BullTabatha)
There remains a significant gulf between the wealth, income, well-being and prosperity of Indigenous people and other Canadians. This chart, taken from a report produced by the Canadian Council for Aboriginal Business, shows that the unemployment rate for Indigenous people is twice that of other Canadians, a gap that seems systemic.
Last year marked a change in economic reconciliation with the release of the National Indigenous Economy Strategy (NIES). Indigenous-led and driven, this strategy guides governments, industry and institutions in their reconciliation work and collaboration in rebuilding Indigenous economies. The NIES presents four strategic pathways, covering Indigenous people, lands, infrastructure and finance, supported by 107 calls to economic prosperity.
The aim is to assert Indigenous empowerment through sovereignty, economic frameworks, capacity and institutions. Progress is still necessary to close gaps in opportunities Indigenous people face in Canada, and the calls to actions under the NIES are the places to focus to see meaningful outcomes.
Layoffs in limbo
Brendon Bernard, senior economist, Indeed.com (@BrendonBernard_)
Some economic indicators have softened of late, but the Canadian unemployment rate remains near its multidecade low. One reason for the labour market’s resilience is that layoffs have been low.
Over the past three months, through to November, 2022, an average of 0.52 per cent of Canadian workers per month were newly jobless owing to layoff or discharge, according to Statistics Canada’s Labour Force Survey. The lowest the rate reached in recent years over the same intervals was 0.6 per cent in 2018. Layoff rates were either at or below their 2017-2019 averages across most industries, including construction and retail trade, despite some signs of slowdowns in these sectors.
As the economy remains in limbo heading into 2023, tracking layoffs will help distinguish the signal from the noise in the headline Labour Force Survey data. Through to November, there are few signs, either in layoffs or employer postings on the job website Indeed, that the Canadian job market has hit a major turning point. This is good news for job seekers today, but it’s less clear if it will last.
Crisis in the care economy
Katherine Scott, senior researcher, Canadian Centre for Policy Alternatives (@ScottKatherineJ)
Since the pandemic struck, there’s been modest employment growth in health care and community services, but these new positions have barely made a dent in the skyrocketing demand for care and support.
Record-high vacancies persist as the rate of retirement in the care economy edges ever higher. In September, there were 159,500 vacant positions in health care and social assistance – notably in occupations such as nursing, early childhood education and community services. Vacancies in these fields have more than doubled over the past three years. Hourly wages, by contrast, have fallen behind; many workers are experiencing real wage cuts.
Nurses saw a nominal wage increase of just eight per cent between 2019 and 2022, even as demand exploded, and inflation shot up by 12.1 per cent. The gap between wage growth and labour demand was even greater among community services workers and early childhood educators.
Governments have promised to create 250,000 new child-care spaces by March, 2026, but who will staff these programs? Existing services are having trouble holding onto current workers. Addressing the low wages and poor working conditions of millions of care workers is crucial to strengthening health and community services – and our economy.
Robots 1, labour 0
Vass Bednar, executive director at McMaster University’s Master of Public Policy Program (@VassB)
I think it’s worth watching the movement on total compensation per hour worked, deflated by the GDP deflator, a measure of inflation in domestically produced goods and services. This metric has grown at a slower rate than labour productivity during the pandemic (from the first quarter of 2019 to the second quarter of 2022).
Analysis from Statistics Canada suggests that “the increase in automation caused by labour shortages and the need to work in a socially distanced work environment could continue to decrease labour’s share of the GDP and prevent real wages from returning to their historical position.”
As corporations continue to resist wage increases, we need to be real – and stay real – about the relationship between productivity growth and the real total compensation that people are taking home.
Help really, really wanted
Katherine Judge, senior economist, CIBC Capital Markets
There’s been a lot of emphasis on getting to a higher unemployment rate to help cool wage inflation, but limiting wage growth can also be achieved by having fewer job vacancies. The tightness in Canada’s labour market is highlighted by the difference in demand for workers relative to supply, shown in the chart. Record levels of job openings and a low unemployment rate are resulting in wage inflation that exceeds the Bank of Canada’s 2-per-cent inflation target, and the bank has increased interest rates aggressively, which should help add slack to the labour market.
Monetary policy makers will be looking for both an easing in job vacancies and a rise in unemployment next year to restore balance in the labour market and return inflation closer to target, adding to supply chain improvements. It takes several quarters for interest rate hikes to work their way through the economy, so the effects of this year’s hikes will become more apparent in 2023, and we don’t see the overnight rate heading any higher from here.
Boomers bowing out
Stéfane Marion, chief economist, National Bank of Canada (@StefaneMarion)
Here’s why we’re not too negative about corporate layoffs and the erosion of household disposable income in 2023: Currently, nearly one-third of the people who leave their jobs and the work force each year do so for retirement reasons, an all-time high.
As this chart shows, for the first time in history, retirements are outpacing growth in the working-age population (ages 15-64) on the eve of an economic downturn. Never before has an aging population allowed employers to reduce their work forces so significantly through attrition rather than mass layoffs.
Tech’s 20-year failure
Viet Vu, manager of economic research, Brookfield Institute for Innovation + Entrepreneurship (@vviet93)
In 2001, one in five tech workers were women. Two decades later, in 2021, that number has not changed, demonstrating the immense structural challenges women still face in the technology sector in Canada. Each woman we drive away from tech is a loss to the Canadian economy we cannot afford, as digitization continues to accelerate as the pandemic eases.
The wage scapegoat
Jim Stanford, economist and director, Centre for Future Work (@JimboStanford)
In recent months, the Bank of Canada has focused on the labour market as the main culprit behind higher inflation: The unemployment rate is too low, wages are rising too fast and this so-called “overheating” is driving up prices. This echoes conventional fears of a wage-price spiral like the one in the 1970s. But empirical evidence suggests wages have lagged inflation – not caused it – by an average of 2.5 percentage points per year since early 2021.
However, another component of production costs – profits – has grown much faster and further, and hence is more culpable in explaining the inflation surge. Corporate profits have swelled dramatically during the pandemic, to the highest share of GDP in history. And those profits are concentrated in the same industries that lead inflation: petroleum, real estate, building materials, car dealers and, yes, supermarkets.
Let’s define unit profit cost as the amount of corporate profit built into each dollar of real output produced in the economy. Unit profit cost has soared almost 50 per cent since 2019. Unit labour costs grew one-third as fast. So instead of targeting workers with anti-inflation medicine, we might consider why profits have grown so substantially – and find ways to short-circuit the profit-price spiral that is fuelling current inflation.
Fallout at the checkout
Mikal Skuterud, professor of economics, University of Waterloo (@mikalskuterud)
Roughly 600,000 Canadians are employed as cashiers, service station attendants and store-shelf stockers, a number that has changed little since 2017. The fortunes of these workers in the years before the pandemic reflected those of low-wage workers across the country, as generous increases in provincial minimum wages and labour-productivity gains produced substantial real wage gains. Inflation as the pandemic has eased, combined with sluggish nominal wage increases, are eroding those gains.
The average real wage rate of Canadian cashiers in October, 2022, was lower than it was October, 2018. As inflationary pressures persist and employers increasingly look to temporary foreign workers to fill low-wage job vacancies, thereby relieving pressures on employers to improve wages and labour productivity, there is reason to worry that the economic fortunes of Canada’s lowest-wage workers will deteriorate further in 2023.
A lasting problem
Michael Willcox, economist, Labour Market Information Council
Job vacancies are at record highs in Canada. Demand for workers exploded in mid-2021 and hasn’t slowed down. Despite stable labour force participation rates and a growing share of immigrants in the work force, supply has not kept up with demand, leading to one of the tightest labour markets in Canadian history.
Efforts by the central bank to tame inflation may dissipate much of the elevated demand for workers but cannot reduce supply-side challenges. Canada’s aging population and low fertility rates continue to contribute to insufficient labour force growth. Boosting participation, immigration and training can increase the size and efficiency of the labour force. Tight labour markets are here to stay; we’d better start planning for them.
MARKETS
Taking stock of recessions
Alexander MacDonald, portfolio manager, GlobeInvest Capital Management
If you were able to predict now, with 100-per-cent certainty, that a Canadian recession was coming in 2023, how would that affect your investment decisions? It would likely be tempting to sell everything and wait until the economy is on stable footing again before buying back in. But if history is any guide, the worst of the recession-driven market performance may already be behind us.
Markets are forward-looking, constantly trying to anticipate events that are often years in the future. How they attempt to anticipate recessions is no different. This chart shows how equity markets have both anticipated and responded to Canadian recessions over the past 40 years.
Since 1982, annual Canadian GDP has decreased year-over-year four times: in 1982, 1991, 2009 and 2020. In three of those four instances, the S&P/TSX Composite Total Return Index fell in the preceding year. The one exception is 2020 – it seems equity markets are poor at predicting global pandemics.
Furthermore, the index increased during every one of those four years of negative GDP growth. At the time of writing, the index is down 3.3 per cent so far in 2022. We’re about to find out whether 2023 will bring Canada’s fifth straight recession rally.
Watch that curve
Sal Guatieri, senior economist, BMO Financial Group
Canadian real GDP growth averaged 3 per cent annualized in the first three quarters of 2022, with little sign of slowing despite fierce monetary tightening. But as the full weight of tighter policy bears down on activity, tougher times lie ahead. To wit, the recent minus-154-basis-point spread between yields on Canada 10-year and one-year securities is the most deeply negative spread since the early-1990s recession. The yield curve is not a perfect guide to downturns, but it is one of the most reliable. Ignore it at your peril.
Loons, hawks and doves
George Pearkes, macro strategist, Bespoke Investment Group (@pearkes)

Loonie is suffering thanks to a
less aggressive Bank of Canada
5-year Canada Gov’t Note yield -
5-year U.S. Gov’t Note yield (%)
Trade-Weighted CAD:
long average = 100
120
0.8
0.6
115
0.4
110
0.2
0.0
105
-0.2
100
-0.4
-0.6
95
-0.8
90
-1.0
85
-1.2
Dec.
2012
Dec.
2013
Dec.
2014
Dec.
2015
Dec.
2016
Dec.
2017
Dec.
2018
Dec.
2019
Dec.
2020
Dec.
2021
Dec.
2022
the globe and mail, source: bloomberg

Loonie is suffering thanks to a less aggressive Bank of Canada
5-year Canada Gov’t Note yield -
5-year U.S. Gov’t Note yield (%)
Trade-Weighted CAD:
long average = 100
120
0.8
0.6
115
0.4
110
0.2
0.0
105
-0.2
100
-0.4
-0.6
95
-0.8
90
-1.0
85
-1.2
Dec.
2012
Dec.
2013
Dec.
2014
Dec.
2015
Dec.
2016
Dec.
2017
Dec.
2018
Dec.
2019
Dec.
2020
Dec.
2021
Dec.
2022
the globe and mail, source: bloomberg
While the Bank of Canada finished 2022 moving from ultrahawkish to a more measured tone, the U.S. Federal Reserve, Bank of England and European Central Bank have all continued to talk tough. Foreign-exchange markets are all about relative relationships, so for the Canadian dollar, the relatively less aggressive Bank of Canada means lower rates compared with major peers. With less compelling returns on Canadian dollars, the loonie has sunk and is likely to continue to suffer from a central bank that feels it needs to start easing off the brakes.
As Alberta goes, so goes the federation
Trevor Tombe, professor of economics, University of Calgary (@trevortombe)
From a deficit of nearly $17-billion two years ago to a projected surplus of well over $12-billion this year, the reversal of Alberta’s fiscal fortunes – owing largely to high oil prices – is astounding. It is, without exaggeration, the most dramatic improvement for a provincial government in all of Canadian history.
But the coming year is highly uncertain. Depending on world oil prices, Alberta’s budget could barely balance in 2023 (with prices for benchmark West Texas Intermediate crude at US$70 a barrel) or post a $20-billion surplus (at US$100 a barrel). This oil royalty roller coaster matters for all of Canada.
Alberta’s new government under Premier Danielle Smith is looking for a fight with the federation. And several of her signature initiatives, such as separating from the Canada Pension Plan, and setting up a provincial tax-collection agency and provincial police force, will not come cheap.
A province flush with cash is a province with room to manoeuvre. Higher incomes also (naturally) increase federal revenue raised from Alberta taxpayers, especially oil and gas companies enjoying record profits. This may bring the federal-provincial fiscal imbalance to new highs and embolden many Albertans to complain of unfair treatment by Ottawa. Regional political tensions are already high, and further increases are unwelcome.
A coming spring election in Alberta makes these risks even greater. For these and other reasons, the province’s fiscal position in 2023 will be an important chart to watch.
In a funk
Eric Lascelles, chief economist, RBC Global Asset Management (@RBCGAMChiefEcon)
China’s economy suffered badly in 2022, with consumer confidence and spending particularly depressed. But that could all be about to change now that the country’s government has abandoned its zero-tolerance COVID restrictions. The year ahead should bring a period of resurgent demand in China, especially as the government also patches problems in the housing market, and that could give a lift to global growth. China is likely to be at cross-currents with the global economy in 2023, accelerating as others are decelerating. This may temper the blow to the global economy, though not to the point of offsetting global weakness altogether.
That’s heavy
Rory Johnston, founder and managing director, Commodity Context (@Rory_Johnston)
A discount to world oil prices has plagued the Western Canadian oil industry for much of the past decade. The relative value of Canada’s primary export blend of crude, Western Canadian Select (WCS), faces two core challenges. The first is quality-related factors: It’s a heavy sour blend of crude that requires more expensive refining equipment compared with easier-to-process crudes such as light sweet West Texas Intermediate. The second is transportation-related: Canadian oil producers, far from domestic consumers and tidewater for ease of shipping overseas, are uniquely dependent on the North American pipeline network to get their barrels to market.
For more than a decade, quality-related factors were relatively stable, while transportation factors such as pipeline constraints were far more volatile. But 2022 was different. Pipeline capacity was largely sufficient – at least until a Keystone pipeline outage in early December refocused attention on Canada’s longer-run pipeline challenges – while quality-related factors such as an oversupply of residual fuel oil stemming from the historical global crisis in refining capacity has punished heavy sour crudes such as WCS.
Looking ahead into 2023, WCS’s quality issues are expected to ease alongside refining bottlenecks, while transportation-related factors, while still far better than much of the pre-COVID experience, will only get tighter until the Trans Mountain Expansion Project enters service.
Leading down
David Rosenberg, founder and president, Rosenberg Research & Associates Inc. (@EconguyRosie)
Who needs an economist when we have the U.S. Conference Board’s leading economic indicator? The data go back to 1959 and never fail to signal the storm clouds (or sunshine) at turning points in the cycle. This forward-looking index has now declined for eight consecutive months. At no time in the past have we seen a string of weakness like this, with an annualized contraction of 5.6 per cent over such a time frame, that failed to presage a recession within a quarter or two. Call it nine for nine back to ’59. The U.S. recession is staring us in the face.
What the Federal Reserve is focusing on is the index of coincident economic indicators, but that only tells you where we are today. And the index of lagging indicators tells you where we were yesterday. The leading indicator is chock full of leading factors such as capital-goods orders, building permits, the workweek and consumer buying plans. The coincident index has non-farm payrolls, and the lagging index consists of the unemployment rate and wage costs.
The Fed is driving the bus all right, but it is not looking through the front window. Which means what? It means we are going to crash land the economy into a recession in the year ahead. This is the theme for 2023 and it is typical for the year that follows the Fed tightening cycle – think 1982, think 1990, think 2001 and think 2007.
The most powerful determinant of the Canadian economy is not monetary policy, fiscal policy or the exchange rate. It is the push and pull from U.S. domestic demand. When the United States catches a cold, as the leading indicator strongly suggests, Canada ends up with the flu.
A game of risk
Kurt Reiman, senior strategist for North America, BlackRock
The BlackRock Geopolitical Risk Indicator tracks the relative frequency of brokerage reports (via Refinitiv) and financial news stories (Dow Jones News) associated with specific geopolitical risks. We adjust for whether the sentiment in the text of articles is positive or negative, and then assign a score that reflects the level of market attention to each risk.
We have seen a surge in market interest in geopolitical risk in recent months, highlighting how fraught the current environment is. Among the risks gaining attention: a global technology decoupling between the United States and China that has significantly accelerated in scale and scope with U.S. export controls; the likelihood of cyberattacks increasing as the Russia-Ukraine conflict persists; and the ever-present risk of intentional or accidental military conflict between NATO and Russia.
HOUSING
Eye on supply
Benjamin Tal, deputy chief economist, CIBC
With the average price of a home down 20 per cent since February, the current price correction is already the steepest on record. However, after factoring in the ascent in prices during the preceding two years, this is by far the mildest correction.
One factor working to limit price declines is the drought of listings. The trajectory of supply of units in the resale market is down notably since the beginning of the correction, as sellers sit on their hands and show hardly any signs of distressed selling to date. That makes this the first correction ever during which the supply of resale units is actually down during a period of notable decline in the sales-to-new listings ratio.
The question as we look ahead is how long this abnormal behaviour of supply, which has so far worked to limit the magnitude of the price decline, will continue.
What skyrockets up …
Farah Omran, economist, Scotiabank (@Farah_Omran)
Canada’s housing market has been undergoing a correction since the Bank of Canada started hiking rates to fight soaring inflation. Some normalization of housing-market activity was expected from the elevated levels seen in 2021 – a year that was the weakest in Canada’s modern history in terms of population growth, but one that broke historical records in terms of home sales activity.
As such, home prices have been declining, clawing back some of the unsustainable gains of 2021 and early 2022. However, despite widely cited declines, the national MLS Home Price Index, which abstracts for sales composition effects, is only 11.5 per cent below the February, 2022, peak and remains 35 per cent above prepandemic levels.
Prices are therefore expected to continue to decline in 2023, but by how much and for how long varies significantly across cities. So far, we have seen bigger price adjustments down from peaks in cities where prices climbed more during the pandemic.
Population dynamics are likely to continue playing an important role, as we are currently experiencing the most rapid pace of population growth in 50 years.
Look up, way up
Ben Rabidoux, founder, Edge Realty Analytics and North Cove Advisors (@BenRabidoux)
Canada’s housing affordability crisis intensified in 2022. Even with a nearly-10-per-cent drop in national house prices from peak levels (based on the MLS Home Price Index), the monthly mortgage payment required to purchase a home at current prices and prevailing interest rates is roughly 45-per-cent higher than one year ago. Until this dynamic improves, either via falling mortgage rates or a further decline in prices, it’s difficult to envision demand returning to anywhere near the levels seen in late 2021 and early 2022.
Rent lament
Matt Lundy, economics reporter, The Globe and Mail (@mattlundy33)
In every major city, rents are surging. The national average rent for units listed on Rentals.ca was slightly more than $2,000 in November, an increase of 12.4 per cent, year over year. In several cities – including Halifax, Toronto and Vancouver – rents jumped by more than 20 per cent in that span. Of course, many tenants are covered by legislation that limits annual increases. Movers, on the other hand, were exposed to brutal conditions. The rental crisis is decades in the making. Canada isn’t building enough homes (including apartments) for a rapidly growing population, and now with rising interest rates, hopeful buyers are stuck on the sidelines, keeping people in rentals longer. Expect more housing stress in 2023.
Trouble building
Stephen Brown, senior Canada economist, Capital Economics
How the economy fares next year will depend crucially on how the construction sector responds to higher interest rates. Developments so far have been encouraging, with housing starts still running above the levels seen immediately before the pandemic.
But as this chart shows for Toronto, housing starts tend to follow new home sales – which are mainly preconstruction sales – by around 12 months, and new home sales have fallen off a cliff after the Bank of Canada’s aggressive rate increases. While the surge in immigration should offer some support to construction, particularly for purpose-built rental projects, the weakness of preconstruction sales raises the risk that construction will fall sharply next year, which would lead to a deeper recession than most people expect.
INDUSTRY AND INVESTMENT
Let’s get real
Carolyn Wilkins, senior research scholar, Griswold Center for Economic Policy Studies at Princeton University; former senior deputy governor, Bank of Canada (@wilkinscarolyna)
Real gross domestic product per capita seems like an unfashionable indicator, especially if you’re of my son’s vintage. I can see why. There are more immediate and important concerns: the cost of living, pressures on health care, and how we’ll deal with an aging population and achieve climate objectives while generating shared prosperity. Add geopolitical and social risks to the list.
Unfashionable or not, GDP per capita is a key performance indicator, since it drives the kind of investments businesses and governments can afford to set up Canadian families and their communities for success. We’ve only just climbed out of the massive hole created during the pandemic, and there’s room to improve if our neighbour is any gauge. U.S. GDP per capita, adjusted for inflation, grew around twice as fast over the past decade as it did in Canada.
When measuring success, however, we mustn’t stop there. I’ll be watching for an update to the Coalition for a Better Future’s scorecard, through a research partnership with the University of Ottawa’s Telfer School of Management, due out in March. It’ll track performance along several fronts: living better, growing sustainably and winning globally.
Tech long and prosper
Lisa Melchior, founder and managing partner, Vertu Capital
With technology playing a central role in the way we live, work and play today, it’s no surprise the tech sector is the fastest-growing segment of the economy and a major contributor to Canada’s prosperity. Despite news of layoffs and swings in stock market performance, the underlying fundamentals of the tech sector continue to be very strong.
Over the past five years, technology’s contribution to Canada’s GDP has materially outperformed all other industries, including into 2022. Indexed from Q4 2016, the tech sector has delivered almost four times more GDP growth than all other sectors of the economy. Looking ahead, tech will continue to drive Canadian growth and productivity, which is why it’s critical we continue to invest in this strategic sector.
Net-zero needs
Mark Carney, chair and head of transition investing, Brookfield Asset Management (@MarkJCarney)
The ratio of clean-energy to fossil-fuel investment over the next decade is probably the most critical indicator of whether the world can meet its net-zero objective. Today that ratio sits around 1-to-1. By 2030 it must rise to between 4-to-1 and 5-to-1. That means a rapid acceleration in clean-energy investment, a process that has already begun.
Importantly, a smooth energy transition will also require some limited and targeted investment in fossil fuels, to maintain the stability of our energy systems and our economies. But the ratio of clean-energy investment to fossil-fuel investment rises from 1-to-1 to at least 4-to-1, not 4-to-0.
Closing time
Stephen Poloz, special advisor, Osler, Hoskin & Harcourt LLP; former Bank of Canada governor
My favourite chart this year is the same as last year: active businesses in Canada, which number more than 900,000. After losing many companies during the pandemic, we have gradually rebuilt, and by late 2021 the number of companies had exceeded prepandemic levels. During the summer of 2022, the rate of company closings began to move above the rate of company creations, causing the population to roll over, and symptomatic of tighter financial conditions and a slowing economy.
Watch for more net company closings as higher interest rates work their way through the system – and if those companies have been looking for workers, we’ll see job vacancies decline at the same time.
Stay on target
Cynthia Leach, assistant chief economist, RBC
Canada is not investing enough in deploying the technologies needed to reach 2030 climate targets. Will the federal government’s recent introduction of a broad clean technology investment tax credit be enough to change the trajectory?
Federal incentives, corporate climate commitments and the push for energy security should see climate investment outperform through the next cycle. But like broader business investment, the capital-intensive sector has to contend with higher interest rates and high uncertainty. So deployment of green solutions will likely vary by technology. More commercially-ready clean technologies with lower risks and better returns should see greater investment, while those with higher risks might see further relative underinvestment. Even then, it may not be enough to keep investment on target.
The starting line
Joe Brusuelas and Tuan Nguyen, chief economist and economist, RSM (@joebrusuelas and @tuannguyen0709)
The year 2023 will be a rare example in which market participants are united in their belief that the Bank of Canada will fail to steer the economy toward a soft landing. If a recession does occur, it won’t be broadly recognized as such until the C. D. Howe Institute’s Business Cycle Council – the arbiter of business-cycle dates in Canada – declares it so.
By drawing on the criteria used by the council to identify when recessions begin and conclude, we can attempt to track the recession start and end dates. The top indicators to monitor are GDP growth, job growth (from the payroll and labour force surveys) and industrial sales. The past two recessions featured sharp declines in the growth rates of all four indicators. Following the same analysis, the Canadian economy was not in a recession in the first three quarters of 2022.
Canada recession tracker
Quarterly growth rates normalized using z-score.
Purple bars equal recessions.
GDP
Industrial sales volume
Labour force survey employment
Payroll survey employment
2008
2015
2022
the globe and mail, Source: statscacan; c.d. howe
institute; rsm u.s.
Canada recession tracker
Quarterly growth rates normalized using z-score.
Purple bars equal recessions.
GDP
Industrial sales volume
Labour force survey employment
Payroll survey employment
2008
2015
2022
the globe and mail, Source: statscacan; c.d. howe
institute; rsm u.s.
Canada recession tracker
Quarterly growth rates normalized using z-score. Purple bars equal recessions.
GDP
Industrial sales volume
Labour force survey employment
Payroll survey employment
2008
2015
2022
the globe and mail, Source: statscacan; c.d. howe institute; rsm u.s.
Nevertheless, we expect the Canadian economy to tip into a recession in mid-2023, once the full impact of restrictive monetary policy is felt. The duration and depth of the recession will depend heavily on how quickly the Bank of Canada gets inflation under control.
Volatility continuing
John Ruffolo, founder and managing partner, Maverix Private Equity (@ruffoloj)
Layoffs, interest rate increases, online retail misses, the FTX fiasco and other bad economic news will continue to cast a chill in the technology capital markets. Coupled with continuing supply chain and logistics issues, protectionism and global conflict, the technology industry faces a lot of uncertainty in the near term. As a result, the technology capital markets will remain volatile for quite some time.
The valuations of private technology companies will be brought back down to Earth from their dizzying heights of 2019 to 2021, and will revert to the long-term mean. Investors will be rebalancing their mix of expectations between growth and profitability, in which the “growth at all costs” mantra will be replaced by “growth with profitability.” Expectations that companies can burn cash forever will disappear in 2023 as there will be more focus on cost reduction and strengthening balance sheets.
The Canadian initial public offering window will be closed for at least the next 12 to 24 months, except for companies viewed as ready and high-quality. Small-cap technology companies will continue to struggle. Acquisitions by foreign-based purchasers or buyout private-equity funds will rise again as lower valuations and currency arbitrage will cause many companies to look “cheap” to potential acquirers.
Despite the uncertainty and the pullback of cross-over investors, particularly for later-stage financings, deal activity will be strong owing to the record amounts of dry powder sitting on the sidelines.
Canada the laggard
Jim Balsillie, co-founder of the Council of Canadian Innovators, co-founder and former co-CEO of BlackBerry
Four decades ago, the traditional production-based economy began transitioning to a knowledge-based economy and, more recently, to a data-driven economy. This shift foundationally reshaped the international competitive landscape, and changed the structure and behavioural characteristics of companies, which became capital-equipment-light and worker-lean, yet operating at global scale and pulling in massive profits by aggressively generating intellectual property and data assets.
Canadian policy makers missed this shift and, as a result, our country started a steady decline in prosperity that continues today. Since 1976, Canada’s productivity performance has been the worst of all advanced economies, resulting in real wages remaining essentially stagnant since then.
The Organization for Economic Co-operation and Development recently projected that Canada’s economy will be “the worst-performing advanced economy over 2020 to 2030 and the three decades after.” And the really bad news? There’s nothing in the current federal budget or associated economic development strategies designed to reverse this trend.
Unless we build the expertise inside our policy community to deal with the structural economic issues surfaced by the rise of the intangible economy, middle-class Canadians will continue to experience a financial squeeze, and our public infrastructure will continue its own path of erosion.
POLICY
No quick fixes
Livio Di Matteo, professor of economics, Lakehead University
Welcoming more than 500,000 immigrants a year by 2025 has raised concerns of whether Canada can keep up. Indeed, 406,000 immigrants in 2021 marked the highest total since 1913, with 2022 projected to top that.
The high absolute totals notwithstanding, the current immigration boom is actually rather modest when considered as a share of population – presently just over 1 per cent per year of our population. Previous boom eras saw annual immigration flows peak as high as 5.3 per cent in 1913. The equivalent today would mean nearly two million immigrants a year.
Even if this immigration boom eventually comes to resemble the more modest highs in the 1920s and 1950s, our ability to deal with it is abysmally poor. An unskilled immigrant in 1912 arrived to a national development and construction boom and the prospect of land grants, but today’s more highly skilled and educated immigrants face high house prices, commodity shortages, steep rents, and a country faced with crumbling infrastructure and weak capital investment. That is the real challenge we face.
Solving labour-shortage issues rooted in an aging population with a quick-fix immigration boom minus a credible strategy to expand capacity and infrastructure is a short-sighted “let them come and we might build it” philosophy. We can do better.
Atlantic Canada’s Catch-22
Frances Woolley, professor of economics, and Connie Lee, Carleton University (@franceswoolley)
Newfoundland and Labrador has the oldest population of any province in Canada. Almost a quarter of its residents are 65 or older. The rest of Atlantic Canada is not far behind. To counter these demographic trends, every Atlantic province has a nominee program approved by Ottawa for immigrants. In addition, there is a federal Atlantic immigration program.
But this chart, which takes immigrant tax filers who arrived in Canada in 2010 and reveals how many remained in their original destination province a decade later, shows that many immigrants who come to Atlantic Canada don’t stay. Some leave Canada altogether; most move to larger and more prosperous provinces.
Atlantic Canada could find itself in a Catch-22: unable to attract immigrants without a strong economy and unable to build a strong economy without immigration.
Yet immigrant retention is about more than economics. All Canadians, immigrant and non-immigrant alike, want to be part of a community. Quebec, for example, retains 94 per cent of its French-speaking immigrants, but only 71 per cent of those who arrive speaking only English. Immigrants who land in Halifax speaking neither English nor French usually end up leaving; those who land in Toronto or Vancouver generally remain there.
People want to live where they feel like they belong. The crucial policy question is: What can be done to make immigrants to the Atlantic provinces feel part of a community and want to stay?
A coal goal reached
Andrew Leach, professor of economics, University of Alberta (@andrew_leach)
When Alberta pledged in 2015 to phase out coal-fired power, with a target of 2030, few thought it was possible. No one thought it was possible by 2023. But that’s just what we’re on track to see here on the Prairies: a complete phase-out of coal-fired electricity generation in Alberta by late 2023 or early 2024. So, without a doubt, this chart is the one I’ll be watching the most in the year to come, as we wait for our first coal-free hour of electricity generation and, eventually, for the last coal-generated megawatt-hour in the province.
Trading places
Carlo Dade, director of trade and investment centre, and John Law, senior fellow, Canada West Foundation (@DadeCWF)
Over the past decade, well before COVID arrived, foreign customers and domestic users of Canada’s trade infrastructure had concerns about the ability of the assets and systems that move goods in and out of our country. From 2009 to 2020, Canada went from being perceived as having trade infrastructure worthy of a top-10 ranking to falling to 32nd spot in the World Economic Forum’s competitiveness ranking. For a country that relies on trade for close to two-thirds of its GDP – three times more than the United States – this is an existential and economic crisis.
A decade of decline is more than one flood, one bad winter or one protest. It is systemic. While the U.S. has also seen its trade capabilities come under pressure, the response there has been a multibillion-dollar infrastructure program to improve competitiveness. Canada’s trade infrastructure woes have instead been met with silence. Rebuilding Canada’s reputation for trade competitiveness will require government and industry collaboration to develop a long-term national plan for our trade-corridor infrastructure.
The post-COVID baby bust
Lindsay Tedds, associate professor of economics, University of Calgary (@LindsayTedds)
Monthly live births by year in Canada
2017
2018
2019
2020
2021
35,000
2020 border
restrictions
begin
34,000
33,000
32,000
31,000
30,000
29,000
28,000
27,000
26,000
Jan.
Feb.
March
April
May
June
July
Aug.
Sept.
Oct.
Nov.
Dec.
the globe and mail, Source: statistics canada

Monthly live births by year in Canada
2017
2018
2019
2020
2021
35,000
2020 border
restrictions
begin
34,000
33,000
32,000
31,000
30,000
29,000
28,000
27,000
26,000
Jan.
Feb.
March
April
May
June
July
Aug.
Sept.
Oct.
Nov.
Dec.
the globe and mail, Source: statistics canada

Monthly live births by year in Canada
2017
2018
2019
2020
2021
35,000
2020 border
restrictions
begin
34,000
33,000
32,000
31,000
30,000
29,000
28,000
27,000
26,000
Jan.
Feb.
March
April
May
June
July
Aug.
Sept.
Oct.
Nov.
Dec.
the globe and mail, Source: statistics canada
Using data on live births, this chart demonstrates that Canada has not yet experienced a post-COVID baby boom. Instead, live births recorded in Canada immediately declined upon the closing of the border in April, 2020. This decline is likely owing to fewer births to new immigrants and non-residents. While births recorded in January, 2021, nine months after the start of the pandemic, are lower than normal, the subsequent number of births throughout the rest of 2021 followed a similar pattern to prepandemic years.
As detailed vital statistics and immigration data that cover the pandemic years become available to researchers, it will be important to study in detail the impact of the pandemic and various public health and border restrictions on patterns and trends in births to be able to determine the short-term and long-term effects of the pandemic on births in Canada.
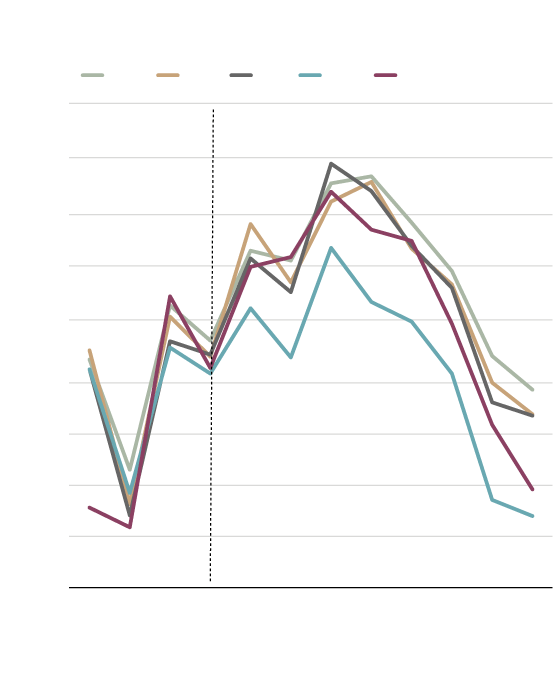
Spend, spend, spend
Alexandre Laurin and William Robson, director of research and CEO, respectively, C.D. Howe Institute (@CDHoweInstitute)
Successive fall fiscal statements from Canada’s finance ministers show federal spending accelerating, even after COVID-related measures drop out of the projections. The government’s last pre-COVID projections in the fall of 2019 showed spending of $421-billion in the 2024-25 fiscal year (the final year in the projections).
Ottawa produced no budget in 2020, but that year’s fall statement showed spending of $429-billion in 2024-25 – a marginal increase. The 2021 fall statement showed spending at $465-billion in 2024-25 – 11-per-cent higher than in 2019. The 2022 fall statement showed spending at $505-billion in 2024-25 – up 20 per cent since the 2019 projection. Not because of COVID. Everything else – transfers, costs of federal employees, interest payments on debt – is up.
About one-third of the higher amount now projected for 2024-25 reflects higher prices, but the government’s relentless spending is a key driver of inflation. The talk of restraint around the 2022 statement was just talk. Before long, Ottawa will need to act.
A distressing trend
Rob Gillezeau, assistant professor of economic analysis and policy, University of Toronto (@robgillezeau)
Over the past two decades, there has been a dramatic increase in Indigenous incarceration, with the number of Indigenous admissions doubling while non-Indigenous admissions have declined. This has occurred over a period of substantial reductions in crime severity nationally.
With the recent resurgence of law and order policy agendas in many Canadian cities, there is a substantial risk that the already distressing trend of Indigenous overrepresentation in correctional facilities could further worsen without appropriate policy interventions. The costs of this overrepresentation are large, with dramatic effects on earning, health and outcomes across generations, resulting in greater inequality.
Mind the birth-rate gap
Marina Adshade, assistant professor, Vancouver School of Economics at the University of British Columbia (@MarinaAdshade)
Canada’s fertility rate dropped in the early 1970s and has stayed low ever since. In fact, 2022 marked the 50th anniversary of the last year that Canadian birth rates were above the level needed to keep the population constant. Nevertheless, the Canadian economy has suffered no ill effects from this long-term trend. Healthy immigration levels kept our work force young and vibrant, and precipitated an inflow of talent and capital. But that dynamic cannot be taken for granted as the gap between low birth rates in Canada and the rest of the world declines.
The birth rate in India, which sends us more immigrants than any other country, has fallen 20 per cent over the past decade. In the Philippines, the second-biggest contributor to Canadian immigration, it plummeted to below the level needed for replacement. In China, the population is projected to decline by the equivalent of three times the current Canadian population over the next 30 years.
Declining world birth rates have the potential for large effects at home. While Canada is not on a United Nations list of countries with a population that is projected to shrink, it’s unlikely we will be able to rely on an inflow of workers to buoy the economy. Internal solutions are necessary, such as increasing the labour force participation of older workers and women with young children.