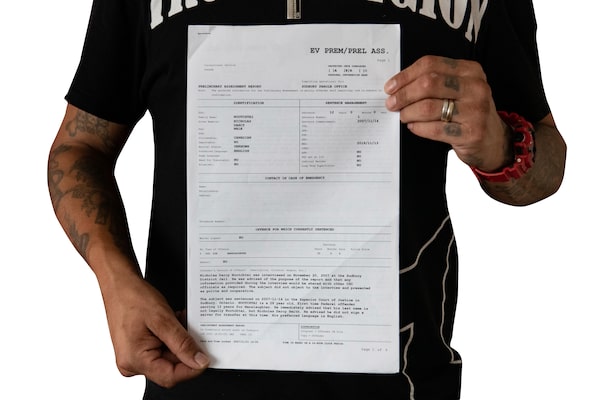
Nick Nootchtai, an Indigenous man who served a full 12-year sentence for manslaughter, holds a copy of the preliminary assessment report he got at the Sudbury Jail in 2007. A Globe and Mail investigation examined how racial biases are built into the standardized tests that prisons use to decide the futures of people like Mr. Nootchtai.Galit Rodan/The Globe and Mail
In depth • Read the full investigation and the backstory
Risk assessments are everywhere in the correctional system.
They’re used by social workers to test an inmate’s intelligence, by psychologists hunting for a diagnosis, and by correctional officers, who rely on them to determine the security level of the prison an inmate will go to and to prepare for parole hearings.
At their most basic, the Correctional Service of Canada’s tools try to summarize an inmate’s past and present as a means of predicting the future. They all turn on a simple question: How much of a risk is this person to public safety?
Some assessments rely on the “professional judgment” of correctional officers – a combination of experience and opinion. Others are “actuarial,” requiring officers to fill out a questionnaire about the inmate and tally up the resulting score, like a dating quiz in a magazine.
These tools are steeped in nearly a century of research and designed decades ago, but still in use today.
They’re also biased against Indigenous and Black people.
We filed a freedom of information request to the Correctional Service of Canada two years ago requesting a copy of the agency’s inmate database. (Read the full investigation here.)
When someone receives a sentence of two years or longer, they become the responsibility of the federal Correctional Service of Canada (CSC). The first thing the CSC does is add the new inmate to their records database, the Offender Management System. The database logs it all: a person’s risk assessment scores, psychological evaluations, correctional plans, progress reports, parole recommendations and more.
The CSC agreed to release seven years' worth of entries, from 2012 to 2018. Each year captured a snapshot of the database on March 31, the last day of the Service’s fiscal year. (You can download the raw data here.)
Extracting this information wasn’t easy. During the release process, the CSC sought approval to release the information to us from several levels of bureaucracy. They even sent our request to Anne Kelly, the head of the service herself, for final approval. We finally received the data we’d requested nearly six months past the legislated deadline to provide it.
The final spreadsheet, clocking in at 744,958 rows and 25 columns, documents in staggering detail the lives of 50,116 people in custody or supervised release. (After filtering out a number of people under provincial jurisdiction, that left us with 741,738 rows and 49,165 unique individuals.)
It lists inmates' age, gender, race and religion; details the length of their sentence and their charges; and notes whether they were doing time at a minimum-, medium- or maximum-security facility, or were on some form of parole. It also contains data on five of the CSC’s most important risk scores.
Taken together, these hundreds of thousands of rows reflect the lives of roughly 12,000 to 14,000 inmates in any given year, and another 8,000 to 10,000 people on some form of conditional release.
The data set is overwhelmingly male – just five per cent of people in custody were women.
It’s also heavily Indigenous. In early 2018, Indigenous people accounted for 27 per cent of inmates in our data, though they represent just 5 per cent of the overall Canadian population. Fifty-three per cent of prisoners that year were white, 8 per cent were Black, and another 12 per cent belonged to other racial groups.
During our months-long analysis, we spoke with more than 60 experts on Canada’s correctional system – correctional officers, former and current inmates, social workers, activists, senators, lawyers and psychologists. We also consulted extensively with several academic experts in criminal justice and statistics to hone our analysis.
We started by examining the share of inmates receiving certain scores, where we found discrepancies in how frequently Black and Indigenous men were being assessed.
Based on those findings, we built a number of statistical models to break down how much different factors contributed to a prisoner’s score. These models looked at a subset of our overall data by limiting the variables to inmates' scores, race, age, gender, the extensiveness and severity of their criminal history, their most serious offence, the year the data was captured, and whether or not the inmate was on a life sentence.
We homed in on two particular risk scores – the offender security level and reintegration score – after experts told us these had the biggest impact on a person’s time inside.
Both scores are assigned to inmates by CSC parole officers, based on interviews and a series of specialized tests filled out by the officers. An inmate receives their initial set of scores during the intake process, when they first arrive at a federal prison.
The offender security level, which can be set to minimum, medium or maximum, is used to match inmates to institutions and treatment programs. An inmate receiving a maximum-security classification will usually end up at a maximum-security institution, or do their time in the max area of a facility.
Officers use an actuarial tool called the Custody Rating Scale, a 12-item questionnaire, to set that first security level, though they can override the score if they decide it’s too high or too low. (Later changes to security classifications are handled with a different tool, which we didn’t focus on.)
Sample: Custody Rating Scale
This is a real inmate’s CRS assessment with their identifying information removed.
The second score we examined, for reintegration potential, estimates an inmate’s likelihood of successfully re-entering society without committing a new offence, and plays a large role during parole hearings.
Officers determine this score by combining the results of several actuarial and non-actuarial assessments. It breaks down into three levels: low, medium and high, with low being the worst score.
For Indigenous and female inmates, the reintegration score is calculated by combining the results of the Custody Rating Scale, the Static Factors Assessment and the Dynamic Factors Identification and Analysis tests. Everyone else is scored by combining results from the Custody Rating Scale, the Static Factors Assessment and the Statistical Information on Recidivism scale. All four assessments were developed by the CSC.
Samples: Static and Dynamic Factors forms
These are redacted excerpts from the Static and Dynamic tests, respectively, from a male inmate at Millhaven Institution serving time for second-degree murder.
Before diving into the data, we first had to clean up and standardize the CSC’s data set – particularly the variables for race, an inmate’s most serious offence and their criminal history.
To consolidate the 34 races in our data into simpler groupings (such as Black, Indigenous, white and Latino), we used Ontario’s Data Standards for the Identification and Monitoring of Systemic Racism, a guide for identifying racial disparities in data. Since our analysis was focused on the differences between white, Black and Indigenous inmates, we further consolidated other races into an “other” category.
Because race is self-reported to the CSC, some inmates' race changes over time – those inmates represent roughly 5 per cent of our data set, or 2,267 people. For our models looking at inmates' security levels, we used their race in the year they were first admitted into custody. Our reintegration models, which looked at several years of an inmate’s score, used the race as declared by the inmate each year.
Once we’d simplified our race categories, we needed to turn people’s charges – described in text form, like “AGGRAVATED ASSAULT – PEACE OFFICER” or “EXTORTION – USE FIREARM” – into numerical values we could control for in our analysis.
We did this by hand-matching the dataset’s more than 700 unique charges to Uniform Crime Reporting Survey offence categories, which could then be cross-referenced to Statistics Canada’s crime severity index weights, a system designed to allow researchers to compare the seriousness of offences over time.
Under this system, Statistics Canada assigns numerical “weights” to Criminal Code violations. For instance, the agency assigned a weight of 6.37 for a charge of adult possession of more than 30 grams of dried cannabis in 2018; first-degree murder, meanwhile, carried a weight of 7,656.16. To find an inmate’s most serious offence, we picked the largest weight for each sentence in a given year.
While an unorthodox use of Statistics Canada’s weighting system, it netted us a rough picture of the severity of an inmate’s charges.
Finally, since the data we had told us nothing about whether an inmate had a criminal record or history of contact with the criminal justice system, we used a proxy by checking whether they had a high “static risk” score. Static risk is determined by the Static Factors Assessment, a CSC tool that measures a person’s past involvement with the criminal justice system. Within the CSC, a high static score means the inmate has had “considerable involvement” with the criminal justice system in the past.
Once we’d cleaned up our data and figured out which scores we’d analyze, we moved on to modelling them.
We used a statistical technique called “logistic regression,” which estimates the odds of one of two outcomes. For example, a researcher might build a logistic regression model to estimate the odds a basketball team will win (or lose) a game, or the likelihood a patient will (or won’t) respond to a drug. This technique is able to measure the impact of multiple variables at once, allowing us to untangle the effects of age, race, gender, etc., on a particular risk score. We picked the logistic regression approach because it’s often used by researchers, including the CSC’s, to study the impact of different risk assessment variables.
For this project, we looked for a 5 per cent statistical significance level in our results, a commonly used standard in these kinds of analyses.
Arriving at a finding within a 5 per cent threshold would be akin to flipping a coin 100 times and getting heads (or tails) at least 60 times. Many of our models had significance values much better than the standard, however. For our model testing how race impacts the reintegration score, the variable for Indigeneity had a result so significant that its probability of occurring was equal to flipping a coin 100 times and getting the same result every single time.
We built three types of models, each using a subset of the data we’d cleaned up. One looked at how race affects an inmate’s security level, another at how race affects the reintegration score, and a third looked at the impact of race and the reintegration score on reoffending. We tested these models in a variety of ways and explored several combinations of variables to eliminate the possibility undetected patterns in our data were distorting our results. While many variables had an impact, our focus was on race and how it related to an inmate’s security level and reintegration score.
In each case, we excluded any entries with missing or incomplete data. (We say “entries” here instead of “people” because a person may leave the correctional system, only to re-enter later on because they reoffended.)
The three models were each run twice – once for men, and once for women.
To test the effect of race on an inmate’s security level, one of our models looked at the likelihood men and women would end up with the worst possible score – a maximum – against the odds they’d receive a medium or minimum one.
The data set for this model looked only at inmates who’d just begun their sentence, since that’s when they are assessed with the Custody Rating Scale. This model looked at 22,922 entries – 21,439 for men and 1,483 for women.
Our security level models arrived at statistically significant results for Black men, but not for Indigenous men; the opposite was true for women. This means our model found that being an Indigenous man didn’t have a discernible effect from being a white man. That doesn’t necessarily mean there is no relationship whatsoever – only that our model and data didn’t suggest one.
With that model, we found that Black men were 23.8 per cent more likely than white men to end up with a maximum security level at admission.
Let’s put those percentages in simpler terms: Say we have 1,000 white men who have committed a variety of offences, all of whom are headed to federal prison. At admission, 900 are placed in minimum or medium security, while the remaining 100 are scored as maximum. If we keep all other aspects of those 1,000 inmates the same, and change only their race from white to Black, an additional 23 men who would’ve otherwise been sent to medium or minimum security would be assigned to maximum security.
Indigenous women, meanwhile, were 64.2 per cent more likely than white women to end up with a maximum security score when they were first admitted.
For our reintegration potential models, we looked at the likelihood someone would end up with a “low” reintegration score versus a medium or high one, and arrived at statistically significant findings for both Black and Indigenous inmates. Unlike the security level models, here we took data for each year an inmate spent in custody, since the reintegration score is recalculated throughout an inmate’s sentence. In all, our data for this model totalled 90,524 entries: 86,762 representing men and another 3,762 for women.
Our modelling found that Indigenous men were 29.5 per cent more likely to end up with a low reintegration score compared to white men, and that Black men were actually 6.1 per cent less likely. For women, Indigenous inmates were 40.2 per cent more likely to end up with a low reintegration score than their white equivalents.
(Due to lower female incarceration rates, we had a far smaller sample of inmates and had much less variance in the proxy variable for criminal history. Our security and reintegration score models for women didn’t include that variable.)
Finally, we also built a model to test how well the reintegration potential score predicted future reoffending. For that analysis, we looked through the data for people who left and later re-entered the federal correctional system on a new sentence, and compared them to people who left the system and never returned. This nets us 28,110 total entries to look at: 26,251 for men and 1,859 for women.
Since we were focused on testing the impact of the reintegration score itself, which is meant to account for things like criminal history and offence severity, our only variables were an inmate’s race, age, the number of years since their release and whether or not they had reoffended. We excluded people on life sentences from this analysis, and additionally dropped the age variable from our model for women.
Our findings with that model netted statistically significant results for Indigenous women and Black men, and nonsignificant but highly suggestive results for Indigenous men.
Results for this model are a bit different than for the other two. Here, we’re testing how much – if at all – race factors into the calculus on whether or not someone is going to reoffend. In theory, if the reintegration score is not racially biased, the effect of any given race after accounting for the score will be close to zero.
That wasn’t what we found. Instead, we learned Black men were 41.1 per cent less likely to reoffend than white men after accounting for their age and reintegration score, and that Indigenous men were 9 per cent less likely – meaning both groups are receiving worse reintegration scores than they should given their demographics and reoffending rates. For Indigenous women, our finding was the opposite: they were 61 per cent more likely to reoffend after controlling for their reintegration score.
We also tracked how well our models performed, much as the CSC does in its own research papers testing its assessments.
For this, we used a standard metric known as the “area under the curve,” or AUC, which points to how well our model distinguished between the two possible outcomes, such as correctly estimating whether someone was put in maximum security versus medium or minimum. An AUC of 0.5 means the model performed no better than a coin toss, being correct only half the time, while an AUC of 1.0 means the model distinguished each case perfectly. In the field of correctional risk prediction, an AUC between 0.56 and 0.63 is generally considered to have small validity, a range of 0.64 to 0.70 is moderate, and anything above 0.71 is high.
Our models had AUCs ranging from 0.653 to 0.835, and performed better for men than women – possibly due to the far smaller number of women in custody, which gave our models less data to work with.
We used a statistical programming language called R that allowed our investigation to be fine-tuned repeatedly and modified as needed. We consulted academics throughout the modelling process, and the project’s code and findings were verified by a Globe data journalist and data scientist, both of whom were previously unaffiliated with the project.
With data verification by Chen Wang and Jeremy Gray.
 Tom Cardoso