It's time to change Wall Street and Bay Street's favourite expression at this time of year: "Sell in May and go away."
The strategy implies that U.S. and Canadian equity indexes move lower from the beginning of May to the end of October. Accordingly, investors should sell their equity holdings at the beginning of May, go on vacation and return to equity markets at the end of October.
So far this year, the strategy has worked amazingly well. Since the end of April, the S&P 500 Index has slipped 6.0 per cent and the TSX Composite Index has dropped 11.6 per cent..
A closer look at the strategy during the past 20 periods paints a different picture.
Frequency of losses were less than expected.
During the past 20 periods, the S&P 500 Index actually increased in 13 periods and the TSX Composite Index gained in 15 periods. During the past 10 periods, both indexes gained in eight periods. However, periods with increases recorded relative small gains, while periods with losses recorded substantial losses. Overall, performances during the past 20 periods for both indexes were negative.
Despite confusing data for the May to October period, there is a grain of truth in "Sell in May and go away" that investors can use to their advantage.
During the May to October period, a major non-recurring event occurs that creates market uncertainty. The events happen when large institutional investors and traders are on holidays and liquidity in equity markets is diminished.
The "grand daddy" event during the past 10 years was the world financial crisis in the summer of 2008. However, an important event has happened in every year since then with the exception of 2009: the summer of 2011 was impacted by the European financial crisis, the summer of 2012 was impacted by the Greek crisis, the summer of 2013 was troubled by Middle East tribulations and the summer of 2014 was jolted by the Ukraine/Ebola crises. This year, equity markets trembled with the 45-per-cent plunge by the Shanghai Composite Index from mid-June to mid-August.
Each of these events triggered a significant increase in equity market volatility.
On every occasion, the VIX Index moved above the 20-per-cent level. Elevated levels reached during the May to October period since 2008 ranged from a low of 21.91 per cent in 2013 to a high of 89.53 per cent in 2008. In late August this year, the Index reached 53.2 per cent.
Identifying the peak in the spike in volatility during the summer period historically has provided an opportunity to "buy the market."
This chart comparing the S&P 500 Index relative to the VIX Index indicates opportunities during the May to October period since 2008.

A chart comparing the TSX Composite Index relative to the VIX Index shows virtually the same opportunities. On every occasion, the S&P 500 Index and the TSX Composite Index recorded significant gains by early January.
How can investors identify the peak in the spike in volatility during the summer period?
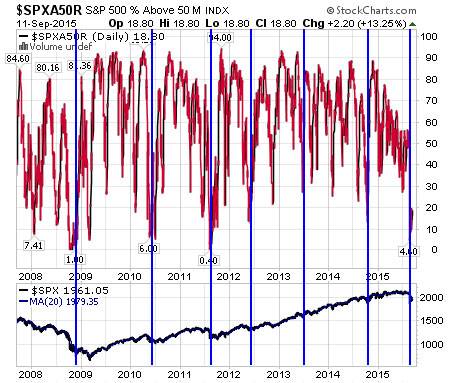
The answer lies with another technical indicator: Percent of stock trading above their 50-day moving average.
When the S&P 500 Index corrects, the indicator normally falls below 20 per cent. A drop below that level and its subsequent recovery sets the stage for the next intermediate uptrend by the Index.
The timelines on the VIX chart and the percent of S&P 500 stocks trading above their 50-day moving average indicated in the charts below are identical.
Most recently, percent reached a low on Aug. 25 at 4.60 per cent and subsequently recovered above the 20-per-cent level. Percent of TSX Composite stocks trading above their 50-day moving average showed similar data by posting a low at 9.72 per cent before recovering. Both indexes reached an important intermediate low on Aug. 25 and are expected to continue to advance during the strongest period for equity markets during the year from the end of October until the first week in January.
Forget about "Sell in May and go away". Think: "Sell in May and buy at the summer's peak in volatility".
Traders and investors can take advantage by owning a wide variety of U.S. and Canadian equities and broadly based Exchange Traded Funds following the rate hike announcement. ETF examples include S&P 500 SPDRs (SPY-N) for U.S. funds. Choices for Canadian funds include iShares S&P/TSX 60 units (XIU-T), Horizons S&P/TSX 60 units (HXT-T) and BMO S&P/TSX Capped Composite units (ZCN-T).
Disclaimer: Don Vialoux is author of free daily reports on equity markets, sectors, commodities and Exchange Traded Funds available at www.timingthemarket.ca. The enclosed report is for information only. It should not be considered as advice to purchase or to sell mentioned securities. Data offered in this report is believed to be accurate, but is not guaranteed.