Hi Lou,
I have been watching Enerflex which once reached a a 52-week high of $21.50. and is now close to its 52 week low. I am wondering if a good buying opportunity exists here. The stock even pays a dividend.
Your thoughts?
Happy Capitalism!
Regards,
Ken
-----
Hey Ken,
Thanks for the assignment. This will be the first time that I examine the case for Enerflex Ltd. (EFX TSX). The company operates internationally providing oilfield services to natural gas and petroleum producers. The company realizes 80% of its revenue from the U.S. and Canada with engineered solutions making up 72% of sales.
An investigation of the charts will help determine if EFX is presenting a good entry point. Once again the caution when you are bottom fishing is to confirm the bottom and avoid anticipating it.

The three-year chart is a classic example of a stock that has been struggling with a trend reversal. Up until August of 2014 EFX was enjoying a nice run to a 52-week high of $21.26 but then the uptrend line was breached and a pathway to pain ensued for those who held on.
By September of 2014 the stock broke below support along the 50 -day moving average and then crashed through the 200-day moving average in October. The final warning sign that there was more to the downside was the death cross that formed in November of 2014 when the shares were trading for close to $17.75.
What has transpired in 2015 is a series of lower highs and lower lows. The breach of support at $14.00 followed by breaks below $13.00 and finally $12.00 has led to a bounce off long term support near $10.50.
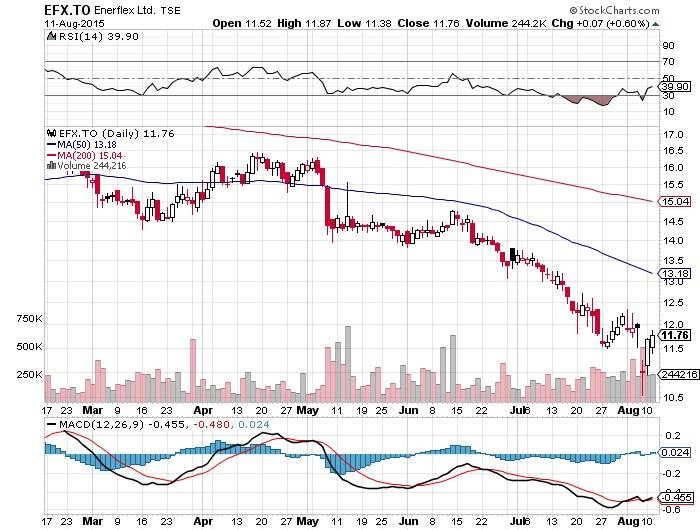
The six-month chart pulls resistance along the 50-day moving average into focus. The MACD and the RSI generated sell signals in May when EFX was trading near $15.50 and again in June just before the break below support at $14.00.
I am finding little evidence that this downtrend is about to reverse itself. The risk factors include an established downtrend line, resistance along the moving averages and an ongoing series of lower highs and lower lows. The dividend yield of 2.89% will pay you something if you decide to get on this ride but don't think you are in a risk free environment. I would suggest continued surveillance for better visibility of a trade shaping up but don't expect a trend reversal in the near term.
Next time I will probe the charts for Zenyatta Ventures Inc. (ZEN TSXV) for Lou.
Make it a profitable day and happy capitalism!
Have your own question for Lou? Send it to lou@happycapitalism.com.