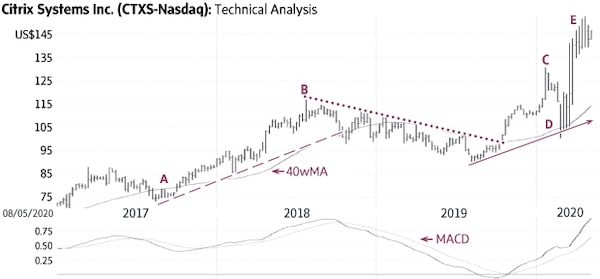
Citrix Systems Inc. (Friday’s close US$150.98) rallied from US$73.33 to US$116.80 (A-B) above a rising trend-line (dashed line) and above its rising 40-week Moving Average (40wMA). It then fell below these indicators in late-2018 to start a down-trend below the falling average and below a falling trend-line (dotted line).
Citrix moved above the falling trend-line and the 40wMA in late 2019 to signal the start of a new up-leg (solid line). The stock rose to a high of US$130.54 in January (C), pulled back to its 40wMA and the rising trend-line (D) and then reached a new all-time high (E).
The stock is becoming overbought and may experience a minor correction toward ±US$125; only a sustained decline below US$110-US$115 would be negative.
Point & Figure measurements provide targets of US$155 and US$165. Higher targets are visible.
stock
Monica Rizk is the senior Technical Analyst and Ron Meisels is the president of Phases & Cycles Inc. (www.phases-cycles.com). And he tweets at @Ronsbriefs. They may hold shares in companies profiled.
Chart source: www.decisionplus.com
Be smart with your money. Get the latest investing insights delivered right to your inbox three times a week, with the Globe Investor newsletter. Sign up today.
 Monica Rizk
 Ron Meisels