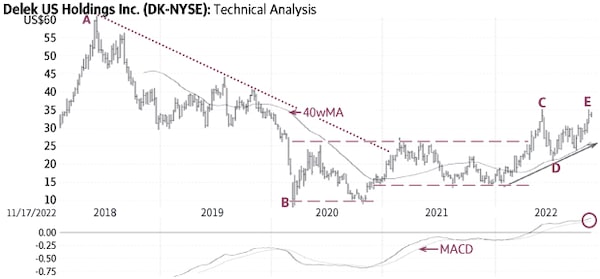
Delek DK-N (Friday’s close US$34.04) declined from US$61.57 in June 2018 to US$7.79 in March 2020 (A-B) below a falling trendline (dotted line) and then settled in a double horizontal trading range mostly between US$10 and US$27 and US$14 and US$27 (dashed lines). The rise to US$35.23 in June signaled a breakout and the start of an uptrend toward higher targets (C).
The stock had a minor correction to the 40-week Moving Average (40wMA) and the rising trendline (solid line) where it found good support near US$22 (D). The recent rise above US$31-32 suggests the resumption of the uptrend toward higher targets (E).
There is good support near US$28-29; only a sustained decline below $25-26 would be negative.
Point & Figure measurements provide targets of US$36 and US$39. Higher targets are visible.
stock
Monica Rizk is the Senior Technical Analyst of the Phases & Cycles publication (www.capitalightresearch.com). Chart source: www.decisionplus.com
Be smart with your money. Get the latest investing insights delivered right to your inbox three times a week, with the Globe Investor newsletter. Sign up today.
 Monica Rizk