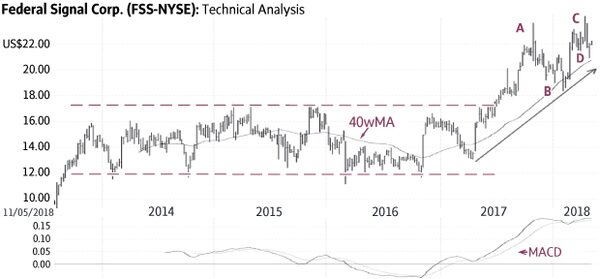
Federal Signal Corp. traded in a large horizontal trading range mostly between US$12 and US$17 for almost four years (dashed lines). The subsequent sharp rise to US$23.63 (A) signaled the breakout from this range and the start of a new major up-trend.
At the same time, this move produced an overbought condition which led to a correction toward the 40-week Moving Average (40wMA – B). Federal Signal has since resumed the up-trend above a rising trend-line (C – solid line). The recent correction should provide a good entry point (D). Only a sustained decline below ±US$20 would be negative.
Point & Figure measurements provide targets of US$24 and US$27. The large trading range supports higher targets.
Monica Rizk is the senior Technical Analyst and Ron Meisels is the president of Phases & Cycles Inc. (www.phases-cycles.com). And he tweets at @Ronsbriefs. They may hold shares in companies profiled.
Chart source: www.decisionplus.com
 Monica Rizk
 Ron Meisels