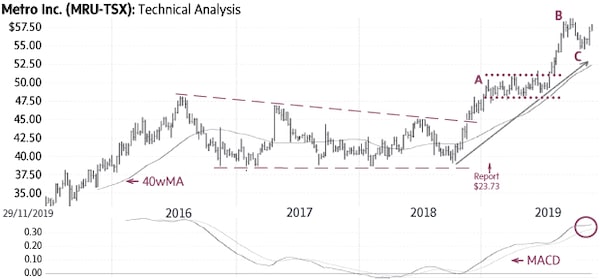
We identified a large wedge pattern (dashed lines) on Feb. 2, 2019, ($47.64) and provided targets of $52 and $57.
Metro Inc. (Friday’s close $58.18) stayed in a horizontal range between $48 and $51 for about seven months (dotted lines) and then resumed the up-trend to a recent high of $59.03 (B).
Subsequently, the stock pulled back toward its 40-week Moving Average (40wMA – C) and now appears ready to resume the up-trend.
Behaviour indicators including the rising 40wMA and the rising trend-line (solid line) confirm the bullish status. Only a sustained decline below ±$52 would be negative.
Point & Figure measurements provide targets of $64 and $69. The large wedge pattern (dashed lines) and the trading range (dotted lines) support higher targets.
stock
Monica Rizk is the senior Technical Analyst and Ron Meisels is the president of Phases & Cycles Inc. (www.phases-cycles.com). And he tweets at @Ronsbriefs. They may hold shares in companies profiled.
Chart source: www.decisionplus.com
 Monica Rizk
 Ron Meisels