National Oilwell Varco (Friday’s close US$44.24) declined from $86.55 in 2014 to $25.74 in 2016 below its falling 40-week moving average (40wMA – A-B). The subsequent rally toward $40 (C) and the pullback toward $30 (D) produced a bullish technical pattern known as a double bottom or “W” formation (dashed lines). The recent rise above the “neckline” of this pattern (dotted line) signalled a breakout and the start of a new up-leg (E).
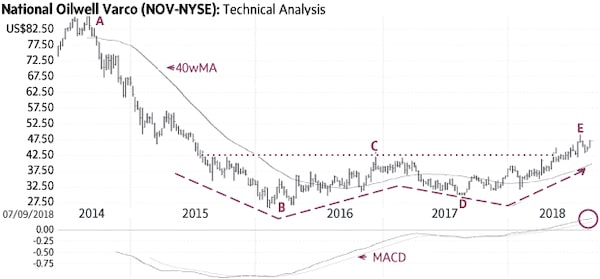
Behaviour indicators including the 40-week moving average (40wMA) confirm the bullish status. The stock is currently in the midst of a minor correction; only a sustained decline below $41-42 would be negative.
Point & Figure measurements provide a target of $54. Higher targets are visible.
Monica Rizk is the senior Technical Analyst and Ron Meisels is the president of Phases & Cycles Inc. And he tweets at @Ronsbriefs. They may hold shares in companies profiled.
Chart source: www.decisionplus.com
 Monica Rizk
 Ron Meisels