Mondelez International (Friday’s close $49.13) rallied from about US$26 in early 2013 (not shown) to US$48 in mid-2015 (A) and then settled in a wide horizontal trading range mostly between US$38 and US$47 for almost four years (dashed lines). The stock traded closer to the lower part of this range over the past year and most recently moved to the top of the range. A sustained rise above ±US$48 would signal a breakout and the start of a new up-leg.
There is good support near ±US$44; only a decline below this level would be negative.
A rise above US$47-US$48 would signal Point & Figure targets of US$54 and US$59. The large trading range (dashed lines) supports significantly higher targets.
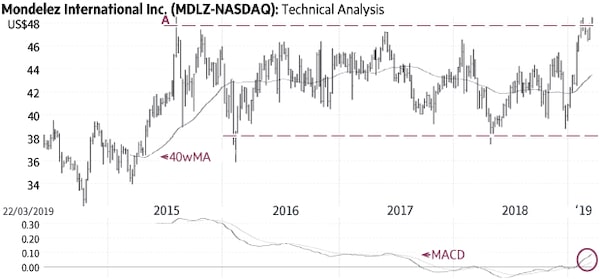
Chart source: www.decisionplus.com?
Monica Rizk is the senior Technical Analyst and Ron Meisels is the president of Phases & Cycles Inc. And he tweets at @Ronsbriefs. They may hold shares in companies profiled.
 Monica Rizk
 Ron Meisels