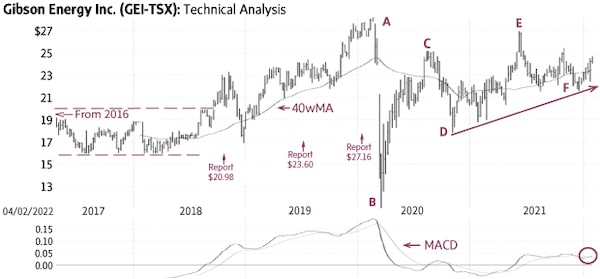
Our initial report (Oct. 27, 2018 – $20.98) identified a large trading range (dashed lines) and provided a target of $25. Subsequent reports confirmed the rising trend and higher targets.
Gibson Energy Inc. GEI-T (Friday’s close $24.33) reached $28.34 in February, 2020 (A), declined temporarily in March (B), recovered to $25.21 (C), had a minor correction toward the trend-line (D – solid line) and then reached $26.98 in June (E).
The most recent pullback toward the 40-week Moving Average (40wMA) found good support near $22 (F) and now the stock appears ready to resume the uptrend; a sustained rise above $25.50 would confirm this.
Behaviour indicators including the rising 40wMA and the rising trend-line confirm the bullish status. Only a sustained decline below $22-$23 would be negative.
Point and Figure measurements provide targets of $27 and $29. Higher targets are visible.
stock
Monica Rizk is the senior Technical Analyst of Phases & Cycles Inc. (www.phases-cycles.com). Chart source: www.decisionplus.com
Be smart with your money. Get the latest investing insights delivered right to your inbox three times a week, with the Globe Investor newsletter. Sign up today.
 Monica Rizk