Are Wheat Prices Poised to Come Up from the Basement?
If any market is susceptible to consistent seasonal patterns, it would be the agricultural products. Due to weather patterns, crops are planted and harvested consistently. It results in regular patterns of supply and demand. Due to this consistency, traders should consider seasonal analysis when analyzing markets for trading opportunities.
All exchange-traded futures contracts have standardized contract months available for trading. They are selected because they encompass the year's planting, harvest, and marketing periods. Supply of these grains is needed throughout the year, and having multiple months available for delivery makes this supply possible.
Wheat trading on the Chicago Board of Trade (CBOT) was planted in the Fall. Crops harvested in a prior harvest season are called "the old crop." In contrast, wheat harvested in July is called "the new crop," bringing new supply to the market.
The wheat market has one new crop month, July, and multiple old crop months, March, May, September, and December. As the market approaches July, supply is still being drawn from old crop months and depleted, resulting in higher prices to ration the crop until new supply arrives. As discussed in this article, a potential upswing in price from the current low prices wheat has traded to.
During the past 52 weeks, wheat prices have fallen by 49%. Managed money has been shorting wheat for a considerable time and has now built a short position size not seen since February 2020, when prices rallied $1.00 per bushel. While concurrently building its most significant net short position since 2019, wheat rallied $1.43.
Seasonal Pattern
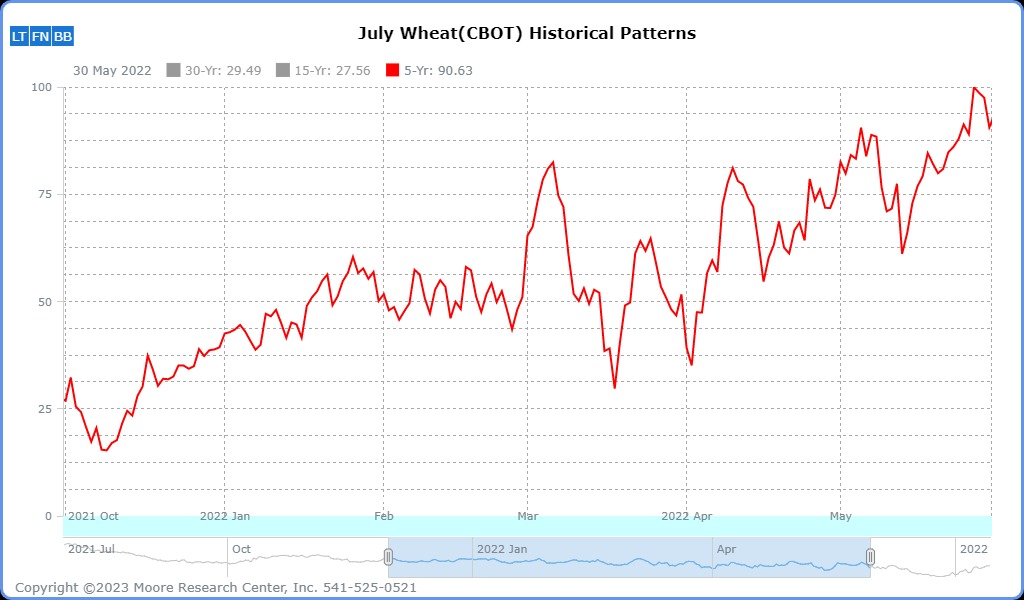
Source: Moore Research Center, Inc. (MRCI)
MRCI illustrates a 5-year seasonal pattern that wheat has followed closely since December. Typically, a 15-year seasonal pattern would be referenced, but the current market has followed the 5-year pattern more consistently.
In a recent article for Barchart, "Corn: Is the News Correlated to Price Movement?" I discuss a similar pattern in corn that wheat is about to experience.
Wheat experienced a price selloff in March. The seasonal pattern indicates that the March lows are a springboard for prices to rally into the July harvest season. This rally will ultimately allow commercial wheat producers to hedge the new crop at higher prices resulting in better profits.
The Commitment of Traders (COT) Report

To confirm MRCI's 5-year seasonal pattern, we will consult the smart money in the wheat market and the commercial traders (red). At the same time, the managed money (blue).
As of March 7th, the commercials were the most bullish they have been in the past 52 weeks. But, what is significant is that the commercials are now net-long wheat, which is strange because wheat commercials are typically net-short. At the same time, managed money is the shortest than at any time in the past 52 weeks. They also hold more open short positions than ever since 2020, resulting in the most prominent net-short position since 2019.
The COT report confirms that the wheat market is a crowded trade with enormous short positions by large speculators. With a low seasonal price due, commercial traders net-long, and the potential for a swift price correction as the trend-following money managers are forced to liquidate their positions, it looks like long wheat is more logical than short.
Technical Picture

Considering we don't use seasonal patterns or the COT report as timing tools, we must consult our charts to manage a trade. Suppose the neckline (red) is broken. In that case, trend followers will begin seeing higher highs and higher lows. This may trigger managed money trend following strategies to liquidate their short positions and repurchase contracts. The vertical green bar could be a target for the inverted head & shoulders (H&S) pattern. The July wheat futures, new-crop month, could get bullish help if this inverted H&S pattern triggers. This is only one possible scenario that could trigger a long position in the wheat market. Perform your due diligence before placing any trades.
Summary
Products to participate in a trading opportunity could be using futures or equities.
The standard-size wheat (ZW) or the mini-sized wheat (XW) contracts for futures traders. For equity traders, the Exchange-Traded Fund (ETF) is WEAT. Equity traders may consider researching companies that would use wheat to make flour, pastries, bread, and cereals by comparing the wheat chart and the company chart while looking for a significant correlation in prices.
More Stock Market News from Barchart
- Stocks Rally as Bank Tensions Ease
- These 3 Buy Rated EV Companies Have >300% Upside Potential
- Oracle Stock Looks Fit for Traders Shorting Puts For Income
- Tencent Holdings Looks to Maintain its Upside Momentum
On the date of publication, Don Dawson did not have (either directly or indirectly) positions in any of the securities mentioned in this article. All information and data in this article is solely for informational purposes. For more information please view the Barchart Disclosure Policy here.