
The S&P/TSX Composite fell 0.23 per cent for the trading week ending with Thursday’s close and now stands 3.0 per cent higher for 2018.

The index remains in technically neutral territory, according to Relative Strength Index (RSI), with a reading of 51. That’s more or less halfway between the buy signal of 30 and the RSI sell signal of 70.

There are 15 oversold, technically attractive benchmark members trading with RSIs below the buy signal of 30. The list is dominated by precious metals stocks. New Gold Inc. is the most oversold company in the index, followed by Barrick Gold Corp., Torex Gold Resources Inc. and Premium Brand Holdings Corp.

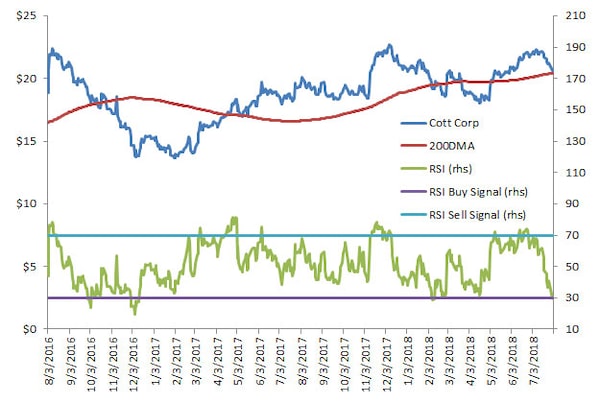
Gold stock moves are far more sensitive to the volatile commodity price than technical factors like RSI, so I chose Cott Corp. for the focus chart this week.

The effectiveness of RSI buy signals has been uneven for Cott Corp. over the past 24 months, but the stock has been frequently sensitive to the 200-day moving average.

As for buy signals, the October 2016 version wasn’t much good at all as the stock continued to head lower. An early December 2016 buy signal was highly useful, however, as the price appreciated 46 per cent to August 2017.

RSI buy signal in February and March of 2018 were merely followed by tiny rallies before selling resumed.

The 200-day moving average appears to have affected stock movements often in the past 24 months. The trend line provided temporary price support in the October and November 2016 time frame, bu,t after the price fell through the 200 day, the line formed resistance to a stronger rally in December.

In May 2017, the 200-day moving average again provided support, allowing the rally to continue for almost another 12 months. Cott’s stock priced danced right along the trend line in March and April this year.

The chart implies that it’s more important that the stock is right at the 200-day moving average than the fact that it’s oversold by RSI. A move below the trend line suggests further downside, but if it bounces off the line and climbs, the short-term outlook gets far more positive.

Fundamental analysis is always a key factor in a company’s stock performance and it should always be completed before any market transaction.

Enercare Inc is. the most overbought, technically vulnerable S&P/TSX company according to RSI this week. CIBC, Gibson Energy Inc. , Transalta Corp. and Aecon Group Inc. are also among the index’s most oversold stocks.

Open this photo in gallery:

NAME RSI 14d PX Last MOV_AVG_200D LAST_CLOSE_TRR_1WK LAST_CLOSE_TRR_YTD PE_RATIO BEST_PE_RATIO
NGD-T NEW GOLD INC 18.41785 1.64 3.387175 -13.22751 -60.29056 7.5601448 30.79054632
ABX-T BARRICK GOLD CORP 21.44317 14.24 17.16165 -1.521438 -21.29685 24.66192691 15.97876748
TXG-T TOREX GOLD RESOURCES INC 21.59348 9.2 12.27985 -9.626719 -22.88349 #N/A N/A 11.72487691
PBH-T PREMIUM BRANDS HOLDINGS CORP 22.79645 102 109.5704 -4.333146 -0.3072054 36.66125254 23.5892692
IFP-T INTERFOR CORP 23.73481 19.87 23.38395 -6.229353 -5.918561 8.741685979 11.30261661
G-T GOLDCORP INC 24.87391 15.83 17.22557 -3.47561 -0.9618639 #N/A N/A 23.43338213
AEM-T AGNICO EAGLE MINES LTD 25.56103 53.76 56.35425 -3.291959 -6.87971 71.33416383 77.78664334
K-T KINROSS GOLD CORP 26.42616 4.44 5.02315 -5.330491 -18.08118 17.55077821 22.19318598
MAG-T MAG SILVER CORP 26.83741 12.08 14.01462 -2.893891 -22.16495 #N/A N/A #N/A N/A
OR-T OSISKO GOLD ROYALTIES LTD 27.03352 11.88 13.53635 -6.012658 -17.51663 254.9629813 73.33333333
MAXR-T MAXAR TECHNOLOGIES LTD 28.1033 59.51 69.68245 -14.53397 -25.60206 58.63580097 10.06197284
HBC-T HUDSON'S BAY CO 28.32005 10.43 10.5051 -6.120612 -7.301179 #N/A N/A #N/A N/A
CG-T CENTERRA GOLD INC 29.01478 5.85 7.06445 0.1712329 -9.16149 7.317168932 6.060723283
BCB-T COTT CORPORATION 29.47885 20.61 20.41095 -3.011765 -1.007583 54.71162317 41.20734803
ACB-T AURORA CANNABIS INC 29.68925 6.74 8.63025 -1.605839 -29.79167 #N/A N/A #N/A N/A
NAME RSI 14d PX Last MOV_AVG_200D LAST_CLOSE_TRR_1WK LAST_CLOSE_TRR_YTD PE_RATIO BEST_PE_RATIO
ECI-T ENERCARE INC 94.04409 28.88 18.82935 54.68666 45.33809 44.04406108 34.17751479
CM-T CAN IMPERIAL BK OF COMMERCE 78.51588 119.61 116.2763 1.493424 -0.09495049 10.42704967 10.03439597
GEI-T GIBSON ENERGY INC 76.70557 18.52 17.32065 5.527066 5.914894 #N/A N/A 41.24721604
TA-T TRANSALTA CORP 76.03807 7.43 7.05745 3.62622 0.8901346 #N/A N/A #N/A N/A
ARE-T AECON GROUP INC 75.97857 16.97 18.08175 10.91503 -13.62467 27.87638345 17.05527638
IFC-T INTACT FINANCIAL CORP 75.91434 103.94 99.79495 7.176737 0.4459352 18.42896082 14.72029458
SES-T SECURE ENERGY SERVICES INC 74.6958 8.43 8.05615 7.421479 -1.822516 #N/A N/A 44.36842105
CPX-T CAPITAL POWER CORP 74.23653 26.89 24.5376 4.023211 13.54233 25.63933812 19.77205882
TIH-T TOROMONT INDUSTRIES LTD 73.85036 66.33 56.5345 1.267176 21.3493 32.71155336 20.56106634
NTR-T NUTRIEN LTD 70.9983 74.32 #N/A N/A 5.71835 #N/A N/A #N/A N/A 19.91257747
AD-T ALARIS ROYALTY CORP 70.60823 18.35 18.04385 4.161712 -6.248813 50.33423683 #N/A N/A

Source: Bloomberg/Scott Barlow

Follow related authors and topics

Authors and topics you follow will be added to your personal news feed in Following.

Interact with The Globe