
A positive week for the S&P/TSX Composite saw equities climb 1.3 per cent to Thursday’s close. Technically speaking, the benchmark’s Relative Strength Index (RSI) reading of 51.1 puts it in neutral territory, roughly mid-way between the oversold buy signal of 30 and the overbought RSI sell signal of 70.

There are eight oversold, technically attractive index member stocks according to RSI this week. Transcontinental Inc is the most oversold company in the benchmark, followed by Celestica Inc., Altagas Ltd., Aecon Group Inc., Canfor Corp., Advantage Oil and Gas Ltd, CCL Industrials Inc. and Kelt Exploration Ltd.

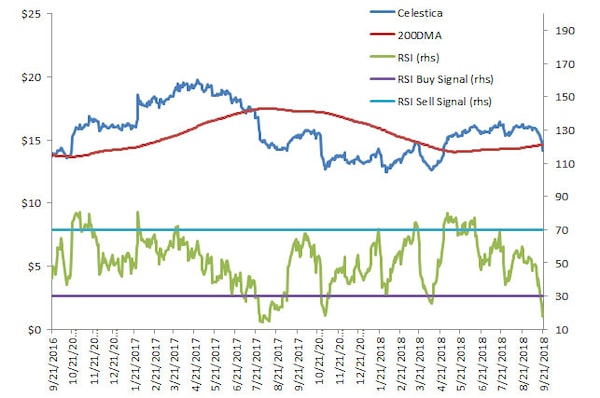
I picked Celestica as the focus chart this week in part to see whether it can provide a window into what’s happening in the technology sector generally. The stock appears to be another case where the 200-day moving average is an important indicator of reliability for RSI buy signals.

In July 2017, Celestica was significantly oversold from late July to early September, but the buy signal was followed by a small rally before further weakness ensued. The same pattern reoccurred in early November 2017, late January 2018 – buy signals predicted a small bounce but not a sustainable rally.

An RSI buy signal on April 9, 2018 did work well as Celestica rallied 31 per cent to mid-July.

The stock does seem sensitive to the 200-day moving average trend line. The 200 day provided price support in September and October 2016, and resistance to further gains on March 15 of this year.

Celestica’s stock price is currently below the 200-day moving average – making the buy signal suspect – but it’s not far below the line. If the price pops above the 200-day, this could become a reasonably interesting buying opportunity.

As always, investors should always complete fundamental research before making any investment.

The Relative Strength index uncovers nine stocks this week that are frothy and overbought, led by Enercare Inc. Nevsun Resources Ltd. is the second most technically vulnerable S&P/TSX member, followed by Torex Gold Resources Inc., Labrador Iron Ore Royalty Co., Alaris Royalty Corp., ATS Automation Tooling Systems , Aurora Cannabis Inc., Methanex Corp., Intact Financial Corp., and Canadian Imperial Bank of Commerce.

Open this photo in gallery:

RSI Price 200DMA Returtn 1W % Return YTD % PE Ratio TTM PE Ratio Fwd
TCL.A-T TRANSCONTINENTAL INC-CL A 11.96223 23.37 27.74075 -3.921567 -3.106484 7.166047727 8.246294989
CLS-T CELESTICA INC 17.49593 14.19 14.5979 -8.687262 7.663123 12.43840635 8.827389477
ALA-T ALTAGAS LTD 22.76205 20.67 26.0575 -10.09369 -21.98153 45.99066854 20.5876494
ARE-T AECON GROUP INC 23.59627 15.69 17.75475 -5.508731 -20.11427 25.81543131 15.69
CFP-T CANFOR CORP 24.90993 25.9 29.5298 -15.02132 4.560129 5.893619399 10.36414566
AAV-T ADVANTAGE OIL & GAS LTD 27.5262 3.21 4.13425 -2.140671 -40.74074 #N/A N/A 33.78947368
CCL.B-T CCL INDUSTRIES INC - CL B 28.98713 60.5 62.51045 -5.693616 3.85463 22.61453984 19.61738003
KEL-T KELT EXPLORATION LTD 29.93877 7.9 7.98215 -3.063727 10.01391 #N/A N/A 42.2459893
RSI Price 200DMA Returtn 1W % Return YTD % PE Ratio TTM PE Ratio Fwd
ECI-T ENERCARE INC 85.57589 28.91 20.28025 -1.31996E-06 46.27851 42.71382747 33.61627907
NSU-T NEVSUN RESOURCES LTD 79.67519 5.775 3.81445 -0.1727079 88.88889 #N/A N/A 159.599166
TXG-T TOREX GOLD RESOURCES INC 78.35213 10.83 11.22495 6.705539 -7.963118 #N/A N/A 14.57462107
LIF-T LABRADOR IRON ORE ROYALTY CO 78.21213 27.96 24.38297 9.645671 5.254034 16.3603963 13.06542056
AD-T ALARIS ROYALTY CORP 77.87658 20.68 18.00185 6.272494 6.358115 56.72545021 #N/A N/A
ATA-T ATS AUTOMATION TOOLING SYS 76.92802 24.13 18.4663 0.875732 55.56271 38.30413958 24.17835671
ACB-T AURORA CANNABIS INC 74.7856 11.91 9.17915 47.59036 27.60417 #N/A N/A #N/A N/A
MX-T METHANEX CORP 73.48849 102.03 83.6546 4.106377 36.18858 15.82040213 11.00379882
IFC-T INTACT FINANCIAL CORP 72.85557 107.68 99.62295 2.49171 5.236727 19.09207677 15.23055163
CM-T CAN IMPERIAL BK OF COMMERCE 72.62827 124.68 117.5264 1.633988 3.90593 10.52044655 10.07433743

Source: Bloomberg/Scott Barlow

Report an editorial error

Report a technical issue

Editorial code of conduct

Tickers mentioned in this story

Study and track financial data on any traded entity: click to open the full quote page. Data updated as of 18/04/24 4:00pm EDT.

SymbolName% changeLast
IFC-T
Intact Financial Corp
+0.98%221.82
ARE-T
Aecon Group Inc
+2.53%17.03
MX-T
Methanex Corp
+0.39%64.83
KEL-T
Kelt Exploration Ltd
-0.5%5.98
LIF-T
Labrador Iron Ore Royalty Corp
+0.33%30.37
CLS-T
Celestica Inc Sv
-1.82%60.34
ACB-T
Aurora Cannabis Inc
+12.06%9.01
TXG-T
Torex Gold Resources Inc
+0.61%19.88

Follow related authors and topics

Authors and topics you follow will be added to your personal news feed in Following.

Interact with The Globe