
The S&P/TSX Composite staged a decent comeback for the trading week ending with Thursday’s close, climbing 1.6 per cent. In terms of Relative Strength Index (RSI), the benchmark is neither overbought nor oversold, with a reading of 40 that is between the buy signal of 30 and the sell signal of 70.

There are 18 oversold, technically attractive index member companies, according to RSI, this week. MAXAR Technologies Ltd., after a hellacious week, is the most oversold stock in the benchmark. Altagas Ltd., Brookfield Renewable Partners, Precision Drilling Corp., Encana Corp., Guyana Goldfields Inc., Freehold Royalties Ltd., Nuvista Energy Ltd., Tamarack Valley Energy Ltd. and Bank of Montreal round out the top ten.

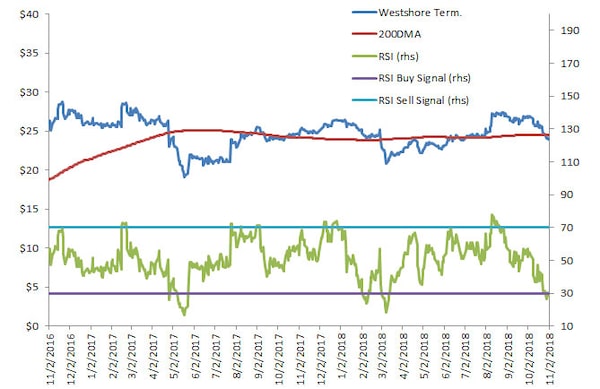
I was tempted to pick BMO as the focus chart, but, because I featured Royal Bank last week, Westshore Terminals Investments is the choice.

RSI buy signals and sell signals have been effective indicators during the past two years. In February of 2017, a sell signal effectively predicted a price decline of 33 per cent to May of that year. At that point, Westshore was dramatically oversold by RSI, and proceeded to rally 30 per cent by early September 2017.

A series of overbought sell signals in December of 2017 preceded a 21-per-cent slide in price before a March 9, 2018 RSI buy signal kicked off a 31-per-cent rally to late August.

Westshore’s stock price has also been sensitive to the 200-day moving average. In the August to November 2017 period and in June and July of this year, the price moved along the trend line.

Past technical patterns offer no guarantees of success, of course, but this is among the more promising charts we’ve looked at in recent months. As always, the fundamental outlook could tell a much different story and investors should always complete fundamental research before any market transaction.

The volatility of recent trading sessions has left only two overbought, technically vulnerable stocks by RSI – InterRent REIT and AeconGroup Inc.

Open this photo in gallery:

RSI Price 200DMA Return 1W % Return YTD % PE Ratio TTM PE Ratio Fwd
MAXR-T MAXAR TECHNOLOGIES LTD 11.23068 19.09 57.8443 -47.67665 -76.01205 #N/A N/A 3.928202445
ALA-T ALTAGAS LTD 18.23698 15.78 24.84235 -24.66793 -40.31419 #N/A N/A 16.6807611
BEP-UN-T BROOKFIELD RENEWABLE PARTNER 18.89278 35.45 39.7386 -4.267807 -14.16402 #N/A N/A #N/A N/A
PD-T PRECISION DRILLING CORP 20.92948 3.185 4.35365 -2.769228 -17.06037 #N/A N/A #N/A N/A
ECA-T ENCANA CORP 23.31313 11.55 15.84735 -14.55467 -29.37087 35.53954256 8.773598683
GUY-T GUYANA GOLDFIELDS INC 23.71539 1.77 4.35675 -39.93289 -64.76378 10.36050353 3.894086859
FRU-T FREEHOLD ROYALTIES LTD 24.57664 9.63 12.2744 -1.492448 -28.28393 #N/A N/A 42.42290749
NVA-T NUVISTA ENERGY LTD 25.17762 5.54 8.06665 -8.080808 -31.9202 12.78276671 11.78723404
TVE-T TAMARACK VALLEY ENERGY LTD 27.18818 3.535 3.87395 -4.065042 23.77622 185.2142977 19.74860335
BMO-T BANK OF MONTREAL 27.92085 99.36 101.4598 -0.1891645 1.746649 11.73620893 10.51985177
CHE-UN-T CHEMTRADE LOGISTICS INCOM FD 28.19068 12.45 15.54235 -1.889542 -29.92563 42.31613659 12.7954779
CAS-T CASCADES INC 28.24309 10.27 13.07405 -1.062804 -24.1441 13.17868013 #N/A N/A
ELD-T ELDORADO GOLD CORP 28.47045 0.93 1.3205 -11.53846 -49.45055 #N/A N/A #N/A N/A
WTE-T WESTSHORE TERMINALS INVESTME 28.49052 23.96 24.45545 -2.362528 -6.998129 14.08164243 13.65242165
POU-T PARAMOUNT RESOURCES LTD -A 28.52295 10.07 15.2131 -4.364327 -48.09475 #N/A N/A #N/A N/A
TD-T TORONTO-DOMINION BANK 29.15545 73.25 75.22485 0.3175016 2.182854 11.96515551 10.81659776
CWB-T CANADIAN WESTERN BANK 29.36061 30.82 35.36345 -0.2605836 -20.28465 10.58022319 9.707086614
VET-T VERMILION ENERGY INC 29.9302 35.43 43.341 0.2123166 -18.47926 23.72360911 20.69509346
RSI Price 200DMA Return 1W % Return YTD % PE Ratio TTM PE Ratio Fwd
IIP-UN-T INTERRENT REAL ESTATE INVEST 74.33429 12.91 10.69095 2.729485 44.30751 7.54077324 #N/A N/A
ARE-T AECON GROUP INC 71.12688 19.04 17.32535 17.36453 -2.207969 22.26598604 17

Source: Bloomberg/Scott Barlow

Report an editorial error

Report a technical issue

Editorial code of conduct

Tickers mentioned in this story

Study and track financial data on any traded entity: click to open the full quote page. Data updated as of 25/04/24 0:59pm EDT.

SymbolName% changeLast
BMO-T
Bank of Montreal
-0.81%126.21
WTE-T
Westshore Terminals Investment Corp
+0.08%25.42
PD-T
Precision Drilling Corp
+1.09%94.02
TVE-T
Tamarack Valley Energy Ltd
-0.52%3.85
FRU-T
Freehold Royalties Ltd
-0.42%14.18

Follow related authors and topics

Authors and topics you follow will be added to your personal news feed in Following.

Interact with The Globe