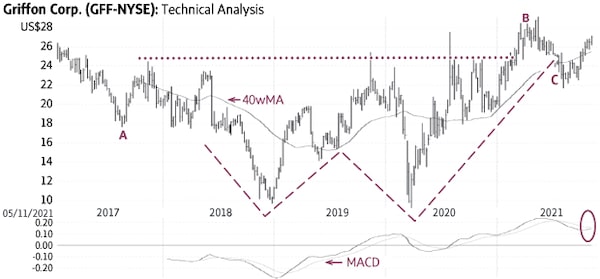
Griffon (Friday’s close US$27.88) declined from US$27.15 in January, 2017 (not shown) to US$17.65 in August of the same year (A) and then built a large bullish base in the form of a “W” pattern (dashed lines).
The stock encountered resistance at the neckline of this pattern near US$25 for three years (dotted line). The rise above the neckline signaled a breakout from this formation and the start of a new major up-trend toward higher targets (B).
The stock has since pulled back and found support near US$22 (C) and now appears to be resuming the up-trend. There is good support near US$24-US$25; only a sustained decline below this level would be negative.
Point & Figure measurements provide an initial target of US$33. The large “W” pattern (dashed lines) supports higher targets.
stock
Monica Rizk is the senior Technical Analyst and Ron Meisels is the president of Phases & Cycles Inc. (www.phases-cycles.com). And he tweets at @Ronsbriefs. They may hold shares in companies profiled.
Chart source: www.decisionplus.com
Be smart with your money. Get the latest investing insights delivered right to your inbox three times a week, with the Globe Investor newsletter. Sign up today.
 Monica Rizk
 Ron Meisels