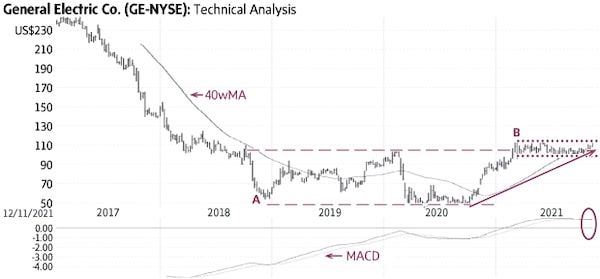
General Electric (Friday’s close US$107.59) declined from US$259.04 in 2016 (not shown) to US$53.28 in 2018 (A) and then settled in a horizontal trading range mostly between US$48 and US$104 (dashed lines). After a rise to US$115.36 earlier this year (B), the stock settled into another range mostly between US$100 and US$115. Only a sustained rise above US$115-116 would signal a breakout and higher targets.
Behaviour indicators including the rising 40-week Moving Average (40wMA) and the rising trend-line (solid line) confirm the bullish potential. There is good support at US$105; a decline below this level would be negative.
A rise above US$115-116 would signal Point & Figure targets of US$136 and US$152. The large trading ranges (dashed lines and dotted lines) support potentially higher targets.
stock
Monica Rizk is the senior technical analyst and Ron Meisels is the president of Phases & Cycles Inc. (www.phases-cycles.com). And he tweets at @Ronsbriefs. They may hold shares in companies profiled.
Chart source: www.decisionplus.com
Be smart with your money. Get the latest investing insights delivered right to your inbox three times a week, with the Globe Investor newsletter. Sign up today.
 Monica Rizk
 Ron Meisels