Chart of the Day: CSG Systems International - More New Highs
The Chart of the Day belongs to the business software company CGS Systems International (CSGS). I found the stock by sorting the Russell 3000 Index stocks first by the most frequent number of new highs in the last month and having a Trend Spotter buy signal then used the Flipchart feature to review the charts for consistent price appreciation. Since the Trend Spotter first signaled a buy on 10/13 the stock gained 8.32%.
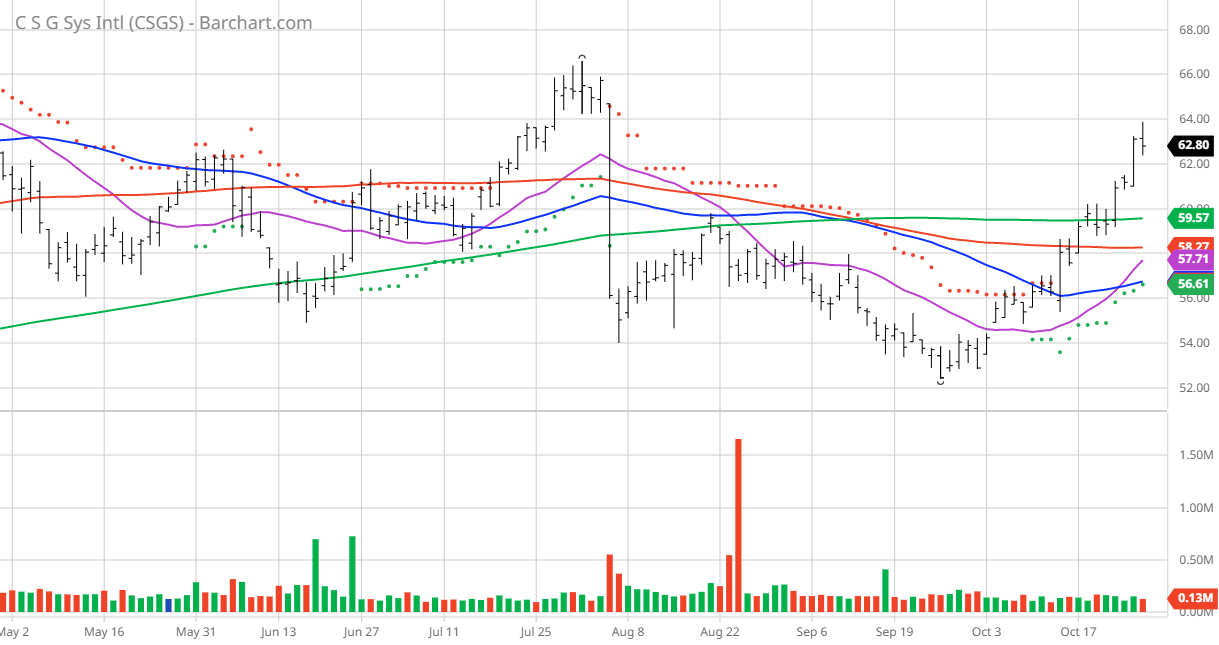
CSGS Price vs Daily Moving Averages ( )
CSG Systems International, Inc. provides revenue management and digital monetization, customer engagement, and payment solutions primarily to the communications industry in the Americas, Europe, the Middle East, Africa, and the Asia Pacific. It offers Advanced Convergent Platform, a private SaaS based platform; related solutions, including field force automation, analytics, electronic bill presentment, ACH, etc. to the North American cable and satellite markets. The company also provides managed services; and professional services to implement, configure, and maintain its solutions, as well as licenses various solutions, such as mediation, partner management, rating, and charging. It serves retail, financial services, healthcare, insurance, and government entities. The company was incorporated in 1994 and is headquartered in Greenwood Village, Colorado.
Barchart's Opinion Trading systems are listed below. Please note that the Barchart Opinion indicators are updated live during the session every 20 minutes and can therefore change during the day as the market fluctuates. The indicator numbers shown below therefore may not match what you see live on the Barchart.com website when you read this report.
Barchart Technical Indicators:
- 8% technical buy signals
- 22.40+ Weighted Alpha
- 25.23% loss in the last year
- Trend Spotter buy signal
- Above its 20, 50 and 100 day moving averages
- 18 new highs and up 19.93% in the last month
- Relative Strength Index 73.75%
- Technical support level at 61.67
- Recently traded at 62.72 with 50 day moving average of 56.75
Fundamental factors:
- Market Cap $2.02 billion
- P/E 21.77
- Dividend yield 1.73%
- Revenue expected to grow 5.90% this year and another 5.10% next year
- Earnings estimated to increase 6.90% this year, an additional 8.10% next year but decrease at an annual rate of 5.00% for the next 5 years projections
Analysts and Investor Sentiment -- I don't buy stocks because everyone else is buying but I do realize that if major firms and investors are dumping a stock it's hard to make money swimming against the tide:
- Wall Street analysts have 3 strong buy opinions in place on this stock
- Analysts have price targets from 72.00 to 73.00 with an average of 72.50
- The individual investors following the stock on Motley Fool voted 98 to 8 for the stock to beat the market with the more experienced investors voting 30 to 0 for the same result
- 1,540 investors are monitoring the stock on Seeking Alpha
Disclosure: I/we have no stock, option or similar derivative position in any of the companies mentioned, but may initiate a beneficial Long position through a purchase of the stock, or the purchase of call options or similar derivatives in CSGS, over the next 72 hours.
Additional disclosure: The Barchart Chart of the Day highlights stocks that are experiencing exceptional current price appreciation. They are not intended to be buy recommendations as these stocks are extremely volatile and speculative. Should you decide to add one of these stocks to your investment portfolio it is highly suggested you follow a predetermined diversification and moving stop loss discipline that is consistent with your personal investment risk tolerance and reevaluate your stop losses at least on a weekly basis.
On the date of publication, Jim Van Meerten did not have (either directly or indirectly) positions in any of the securities mentioned in this article. All information and data in this article is solely for informational purposes.
Provided Content: Content provided by Barchart. The Globe and Mail was not involved, and material was not reviewed prior to publication.