There are many ways to approach portfolio building. All have their own strengths and weaknesses, which is why I have created several different types of model portfolios.
My Aggressive TFSA Portfolio was launched four years ago, in March 2012. It invests exclusively in stock-based ETFs and is designed for readers whose goal is to maximize tax savings in their TFSAs and who are willing to accept a higher degree of risk and volatility. As I have cautioned in the past, this is not a model to use if you are saving for retirement, a child's future education, or a major purchase to be made within five years.
Here's a look at the ETFs in the portfolio with some comments on how they have fared since our last review on Sept. 23. Results are as of the afternoon of March 16.
iShares Core S&P/TSX Capped Composite Index ETF (XIC-T). This ETF tracks the performance of the S&P/TSX Composite Index. It hit its lowest point in three years in January but has since rallied somewhat and we are up by 8 cents per unit from the last review in September. We received a quarterly distribution of 16.93 cents in late December.
iShares S&P/TSX Small Cap Index ETF (XCS-T). Canadian small cap stocks finally staged a rally in recent weeks and the price of these units followed along. The shares are up 39 cents since the last update plus we received a small year-end distribution of 5.24 cents per unit. The net result is a gain of 3.5 per cent since September. This ETF is still in the red, but we're starting to trim the loss.
iShares U.S. Small Cap Index ETF (CAD-Hedged) (XSU-T). U.S. small-cap stocks didn't do as well as their Canadian counterparts during the latest period. The unit value fell $1.61 and the year-end distribution of 18.63 cents didn't do much to stem the damage. The result was a loss of 5.7 per cent over the period.
iShares Core S&P 500 Index ETF (CAD-Hedged) (XSP-T). This ETF tracks the performance of the S&P 500 Index, hedged back to Canadian dollars. It traded above $24 in early December, then fell off a cliff in January before rebounding in recent weeks. We received a semi-annual distribution in December of just under 25 cents per share.
BMO Nasdaq 100 Equity Hedged to CAD Index ETF (ZQQ-T). This fund provides exposure to the top 100 stocks on the Nasdaq exchange. It gained 59 cents per unit in the latest period plus we received an annual distribution of 28.5 cents for a gain of 2.6 per cent over the six months. This ETF is the No.1 performer in the portfolio.
iShares MSCI EAFE Index ETF (CAD-Hedged) (XIN-T). This fund invests in large-cap companies from developed countries in Europe, Asia, and Australasia, hedged back to Canadian dollars. It's really a Canadian replica of EFA, which trades in New York and which should be your choice if you don't want the hedging feature. XIN lost 35 cents per share in the latest period. However, we received a year-end distribution of 18.55 cents for a net loss of only 0.7 per cent.
iShares MSCI Frontier 100 ETF (FM-N). Frontier Markets continue to struggle, dragging down the price of this ETF that tracks major companies in Third World countries from Nigeria to Vietnam. The shares are off $1.58 in the past six months although we have seen a bit of a rally recently. We received a year-end distribution of 8.35 (U.S.) per unit.
iShares MSCI Emerging Markets ETF (EEM-N). We added 25 shares of this emerging markets fund in April 2014 when it was trading at $41.57 (U.S.). The shares did well for a few months, topping $45 in June but then went into a long decline as investor concerns grew over the prospects for emerging markets. That downward trend continued until January of this year but since then the units have turned around and are now 49 cents higher than at the time of the September review. Plus we received a year-end distribution of 50 cents per unit.
We received $2.82 in interest from the cash balance in a high-interest savings account.
Here's a look at how the portfolio stood on the afternoon of March 16. The Canadian and U.S. dollars are treated at par and commissions are not taken into account. The percentage in the Gain/Loss column represents the cumulative return since the portfolio was launched or since the security was added.
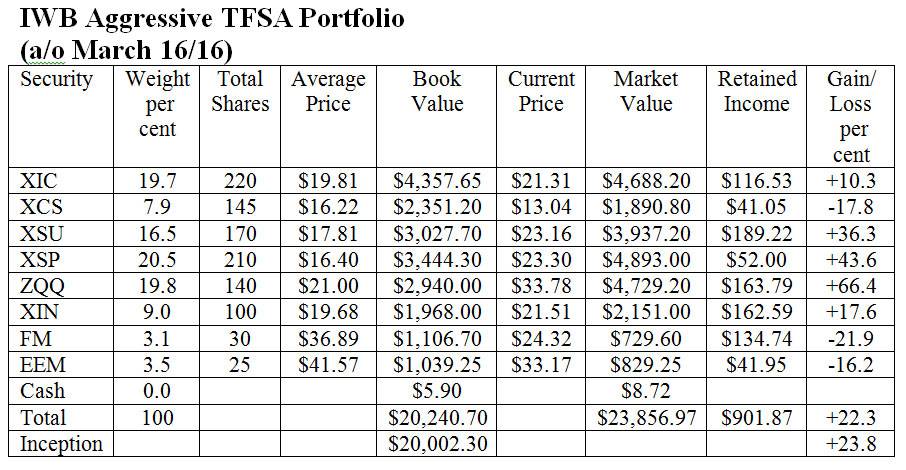
Comments: We managed a fractional gain of 0.7 per cent in the latest six-month period, due mainly to the distributions we received. It's not a lot but, given the extreme market volatility we have seen, anything in the black is a plus. The compound annual growth rate over the four years since this portfolio was created is 5.5 per cent. That's not bad for a passive portfolio in volatile markets but it is well below my target of 10 per cent to 12 per cent. We'll need a strong global market recovery to get near those levels and I don't see that happening any time soon so patience is needed.
Structurally, this is a sound portfolio with global representation. It covers all the major world indexes plus North American small cap stocks, emerging markets, and frontier markets. But since it invests only in equity ETFs, there is no place to hide in rough times. That makes this portfolio suitable to only aggressive investors with a mid- to long-term time horizon.
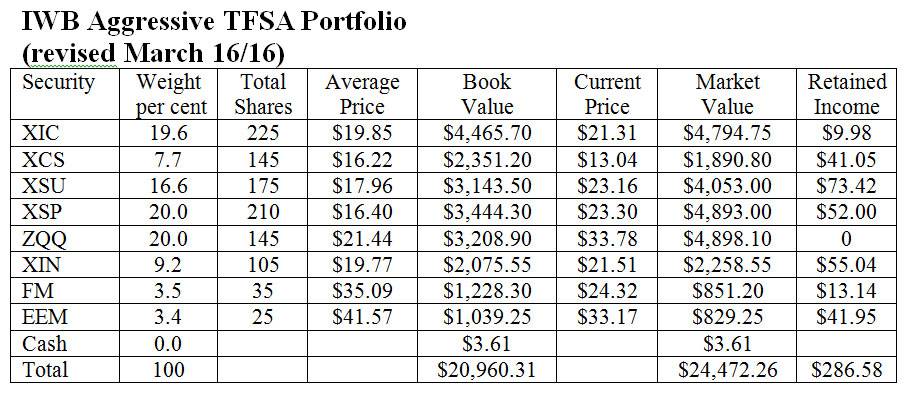
Changes: We'll use some retained income to add to a couple of positions. Don't make these small trades on your personal account; use a dividend reinvestment plan instead.
XIC. We will add five units at a cost of $196.55. That will bring the total to 225 and reduce our retained distributions to $9.98.
XSU. We'll buy five units for $115.80, to bring our total to 175. Cash remaining will be $73.42.
ZQQ. It's a bit of a stretch but we'll add five units for a cost of $168.90 to increase the total to 145. This will use up all our retained income and we'll take the remaining $5.11 from the cash account, reducing it to $3.61.
XIN. We'll invest $107.55 in five more units to bring the total to 105. That leaves $55.04 remaining.
FM. In the hope that frontier markets are bottoming out, we'll add five units at a cost of $121.60 to increase the total to 35. Retained income will drop to $13.14.
Here is the revised portfolio. We'll invest the cash and retained income of $290.19 in a high interest savings account paying 0.8 per cent. I'll revisit this portfolio in September.
Gordon Pape is Editor and Publisher of the Internet Wealth Builder and Income Investor newsletters.