The S&P/TSX Composite fell 1.3 per cent for the trading week ending with Thursday's close.
The weaker performance erased the previously frothy market conditions according to Relative Strength Index (RSI). The current RSI reading of 48.2 is in technically neutral territory, approximately mid-way between the buy signal of 30 and the sell signal of 70.
There are six TSX stocks trading at oversold, technically attractive levels below the RSI buy signal. Cenovus Energy Inc. is the benchmark's most oversold company followed by Crew Energy Inc., Loblaw Co Ltd., Crescent Point Energy Corp., MEG Energy Corp. and Imperial Oil Ltd.
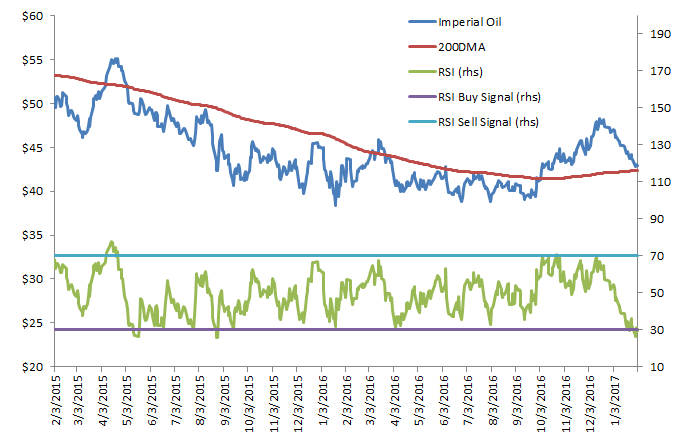
I picked Imperial Oil as the focus chart this week despite my usual hesitation to use commodity stocks for technical analysis – too often, they are more affected by commodity prices than the technical outlook.
In Imperial Oil's case, however, I noticed something potentially useful in that the stock appears very sensitive to its 200-day moving average. At $42.86, the price is exactly at the 200-day at this point.
Technical traders are fond of saying "support becomes resistance." This means that once a stock price falls below major support levels – the 200-day is an example of this – it will have will have trouble regaining that level.
This has certainly been the case with Imperial Oil. It fell through its 200-day in May of 2015. After that it tried and failed to rise or hold above the trendline five times; August and December 2015, and March, June and July 2016. The stock finally breached and held the 200 day in April 2016.
The stock is now oversold by RSI and testing the 200-day moving average to the downside. Based on the high degree that the trend line affected the price previously, it is very important that Imperial Oil stay above the 200-day, or the risk of a sustained down trend rises.
The fundamental outlook for the stock or the oil price could easily trump the technical, so investors should always complete fundamental research before making any market transactions.
There are seven benchmark stocks trading above the RSI sell signal of 70, indicating they're vulnerable to a correction in the short term. Kirkland Lake Gold Ltd. is the most overbought company, followed in order by Barrick Gold Corp., Mag Silver Corp., Pan American Silver Corp., Maple Leaf Foods Inc., Rogers Communications Inc. and Torex Gold Resources Inc.
Follow Scott Barlow on Twitter @SBarlow_ROB.
