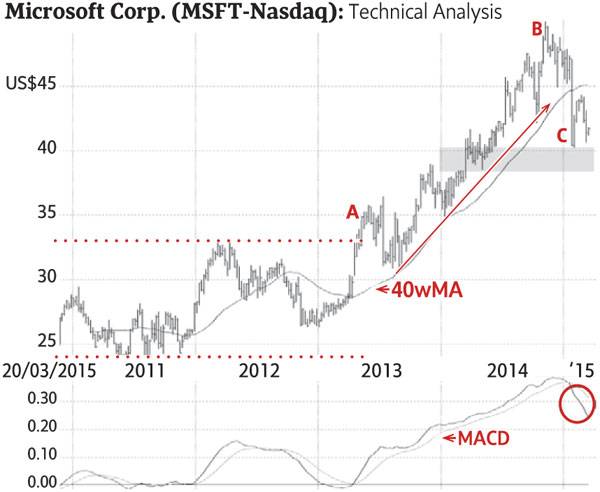
Microsoft Corp. had a breakout in 2013 (A) from an extremely large base (dotted lines) and continued to rise, as indicated by the ascending trend-line (solid line). It reached a high of $50.05 (U.S.) in 2014 (B). The recent decline below the 40-week moving average and below the rising trend-line (C) shows negative investor behaviour. Only a sustained rise above $47-$48 would reverse the existing negative trend. There is some support in the $38-$40 range (shaded area) and a decline below this level would be negative. Expect a period of consolidation before Microsoft can resume the long-term up-trend.
Monica Rizk is the senior technical analyst for Phases & Cycles Inc. (www.phases-cycles.com). Ron Meisels is a contributor to the www.NA-marketletter.com website and Tweets at @Ronsbriefs. They may hold shares in companies profiled. Please see the site for a glossary.
