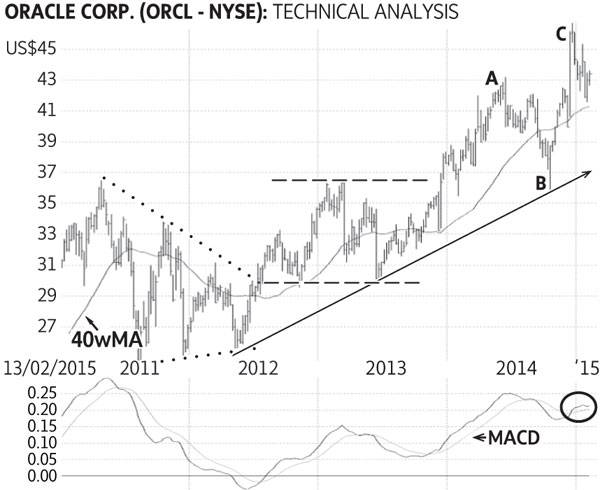
Oracle Corp. stayed in a large triangle pattern made up of lower highs and higher lows in 2011-2012 (dotted lines), then rallied above this triangle and settled in a large horizontal trading range mostly between $30 (U.S.) and $36 (dashed lines). The stock subsequently rallied to $43.19 (A), pulled back to the rising trend-line (solid line - B) and recently reached a high of $46.15 (C) to signal renewed investor interest and the resumption of the long-term up-trend. Current prices should provide a good entry level. Only a sustained decline below $40-$41 would be negative. Point & Figure measurements provide targets of $49 and $54. Higher targets are visible.
Monica Rizk is the senior technical analyst for Phases & Cycles Inc. (www.phases-cycles.com). Ron Meisels is a contributor to the www.NA-marketletter.com website and Tweets at @Ronsbriefs. They may hold shares in companies profiled. Please see the site for a glossary.
