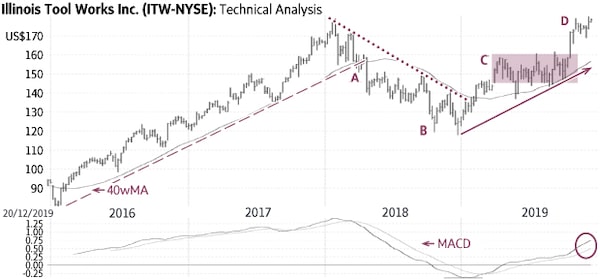
Illinois Tool Works Inc. (Friday’s close US$181.09) traded above a rising trend-line (dashed line) and above its rising 40-week Moving Average (40wMA) for about two years. It fell below both indicators in 2018 (A) to signal the start of a down-trend (dotted line). The stock found support near ±$120 and then reversed the negative trend as it rose above the falling trend-line (dotted line) and its 40wMA (C).
Illinois Tool Works spent the subsequent seven months in a trading range mostly between US$143 and US$161 (shaded area). The recent rise above the top of this range signalled a breakout and confirmed the start of a new up-trend (solid line).
There is good support at US$168-US$169; only a sustained decline below ±US$155 would be negative.
Point & Figure measurements provide targets of US$200 and US$220. Higher targets are visible.
stock
Monica Rizk is the senior Technical Analyst and Ron Meisels is the president of Phases & Cycles Inc. (www.phases-cycles.com). And he tweets at @Ronsbriefs. They may hold shares in companies profiled.
Chart source: www.decisionplus.com
 Monica Rizk
 Ron Meisels