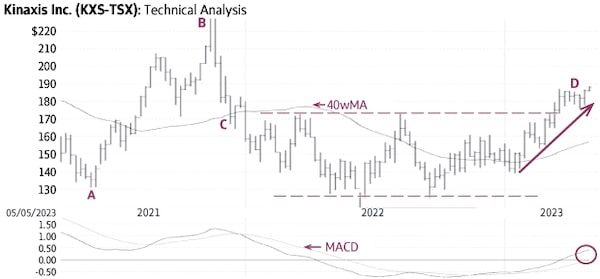
Kinaxis KXS-T rallied from $130.88 in June 2021 to $229.98 in November of the same year (A-B), reversed the trend in December as it fell below the 40-week Moving Average (40wMA – C) and then settled in a large horizontal trading range mostly between $125 and $175 (dashed lines). The recent rise above this range signaled a breakout and the start of a new up-trend toward higher targets (D).
Behaviour indicators including the rising 40-week Moving Average (40wMA) and the rising trendline (solid line) confirm the bullish status. A minor correction toward $165-170 would provide a good entry level. Only a sustained decline below $160-165 would be negative.
Point & Figure measurements provide an initial target of $229. A sustained rise above $230 would signal higher targets
stock
Monica Rizk is the Senior Technical Analyst of the Phases & Cycles publication (www.capitalightresearch.com). Chart source: www.decisionplus.com
Be smart with your money. Get the latest investing insights delivered right to your inbox three times a week, with the Globe Investor newsletter. Sign up today.
 Monica Rizk