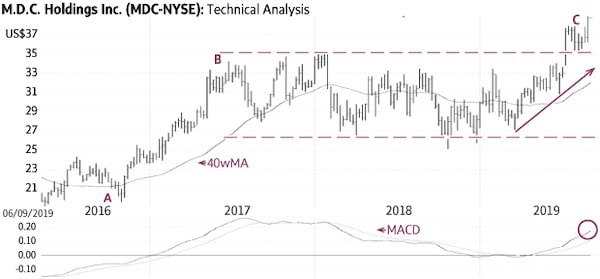
M.D.C. Holdings Inc. (Friday’s close US$38.97) rallied from US$19.67 in November, 2016, to US$34.18 in June, 2017, (A-B) and then stayed in a horizontal trading range mostly between US$26 and US$35 for about two years (dashed lines). The recent rise above the top of this range signalled a breakout and the start of a new up-trend (C).
Behaviour indicators including the rising 40-week moving average (40wMA) and the rising trend-line (solid line) confirm the bullish status. There is good support near US$33 to US$34. Only a sustained decline below ±US$32 would be negative.
Point & Figure measurements provide targets of US$42 and US$47. The large trading range (dashed lines) supports significantly higher targets.
Monica Rizk is the senior technical analyst and Ron Meisels is the president of Phases & Cycles Inc. (www.phases-cycles.com). And he tweets at @Ronsbriefs. They may hold shares in companies profiled.
rb-gi-meisels-0907stock
Chart source: www.decisionplus.com
 Monica Rizk
 Ron Meisels