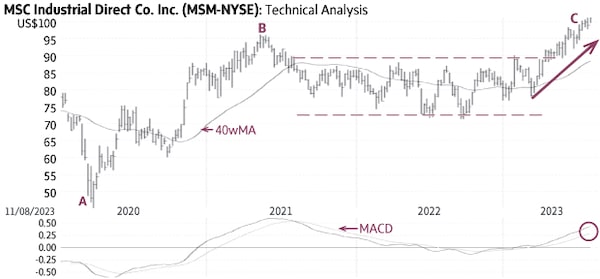
MSC Industrial Direct MSM-N rallied from US$44.93 in March 2020 to US$96.23 in May 2021 (A-B) and then settled in a large horizontal trading range mostly between US$72 and US$88 (dashed lines). The recent rise above the top of this range signaled a breakout and the start of a new uptrend toward higher targets (C).
Behaviour indicators including the rising 40-week Moving Average (40wMA) and the rising trendline (solid line) confirm the bullish status. MSC Industrial Direct is becoming overbought as it rises further above the 40wMA. A minor correction toward US$92-94 would provide a better entry. Only a sustained decline below US$89-90 would be negative.
Point & Figure measurements provide targets of US$110 and US$125. The large trading range (dashed lines) supports higher targets.
stock
Monica Rizk is the Senior Technical Analyst of the Phases & Cycles publication (www.capitalightresearch.com). Chart source: www.decisionplus.com
Be smart with your money. Get the latest investing insights delivered right to your inbox three times a week, with the Globe Investor newsletter. Sign up today.
 Monica Rizk