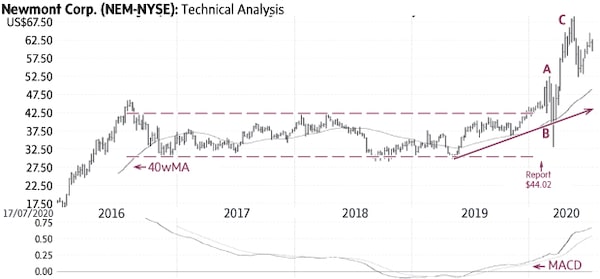
On February 8, 2020 (US$44.02) we reported a major breakout from a large trading range (dashed lines) and provided targets of US$49 and US$53. Shortly afterward, Newmont Corp. (Friday’s close US$85.35) rallied to US$52.50, essentially fulfilling our targets (A). The stock then pulled back toward its 40-week Moving Average (40wMA) and the rising trend-line (solid line), and even temporarily below these indicators (B) before it quickly resumed the up-trend (C). The stock recently had a correction toward its rising 40-week Moving Average (40wMA) for another attractive entry point; there is good support near ±US$53-55. Only a sustained decline below the 40wMA (currently near ±US$50) would be negative. Point & Figure measurements provide a target of US$74. The large trading range supports higher targets.
stock
Monica Rizk is the senior Technical Analyst and Ron Meisels is the president of Phases & Cycles Inc. (www.phases-cycles.com). And he tweets at @Ronsbriefs. They may hold shares in companies profiled.
Chart source: www.decisionplus.com
Be smart with your money. Get the latest investing insights delivered right to your inbox three times a week, with the Globe Investor newsletter. Sign up today.
 Monica Rizk
 Ron Meisels