Monica Rizk is the senior Technical Analyst and Ron Meisels is the president of Phases & Cycles Inc. (www.phases-cycles.com). And he tweets at @Ronsbriefs. They may hold shares in companies profiled.
Gildan Activewear (Friday’s close $40.74) rallied from $9.57 in December, 2011, (not shown) to $45.73 in July, 2015, (A) above a rising trend-line (dotted line) and rising 40-week Moving Average (40wMA). It then settled in an extremely large Triple Bottom formation (solid lines) below the ±$42 level (shaded area). The recent rise above this pattern signalled a breakout and the start of a new up-leg (B).
Behaviour indicators including the rising 40wMA confirm the bullish status. Gildan Activewear has good support at $39-$40; only a sustained decline below ±$38 would be negative.
Point & Figure measurements provide targets of $49 and $54. The Triple Bottom pattern (solid lines) supports higher targets.
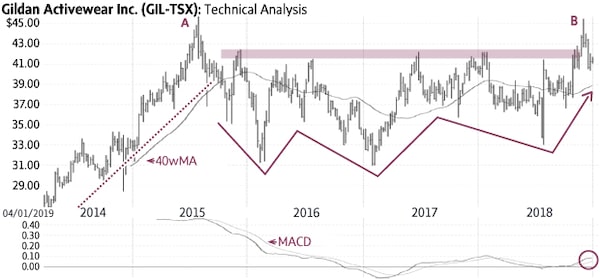
Chart source: www.decisionplus.com
 Monica Rizk
 Ron Meisels