September Covered Calls Trades On Dividend Stocks Update #1
By Donald E. L. Johnson
Cautious Speculator
- The September covered calls trades involve 13 dividend stocks.
- It is assumed that markets will be lower by the September 15 close of markets.
- At the money covered calls trades have been made on mostly weaker stocks.
Since I published my September expiration covered calls trades on dividend stocks, I’ve made several more trades on stocks that I own.
Click on images and zoom in for better views of the data.
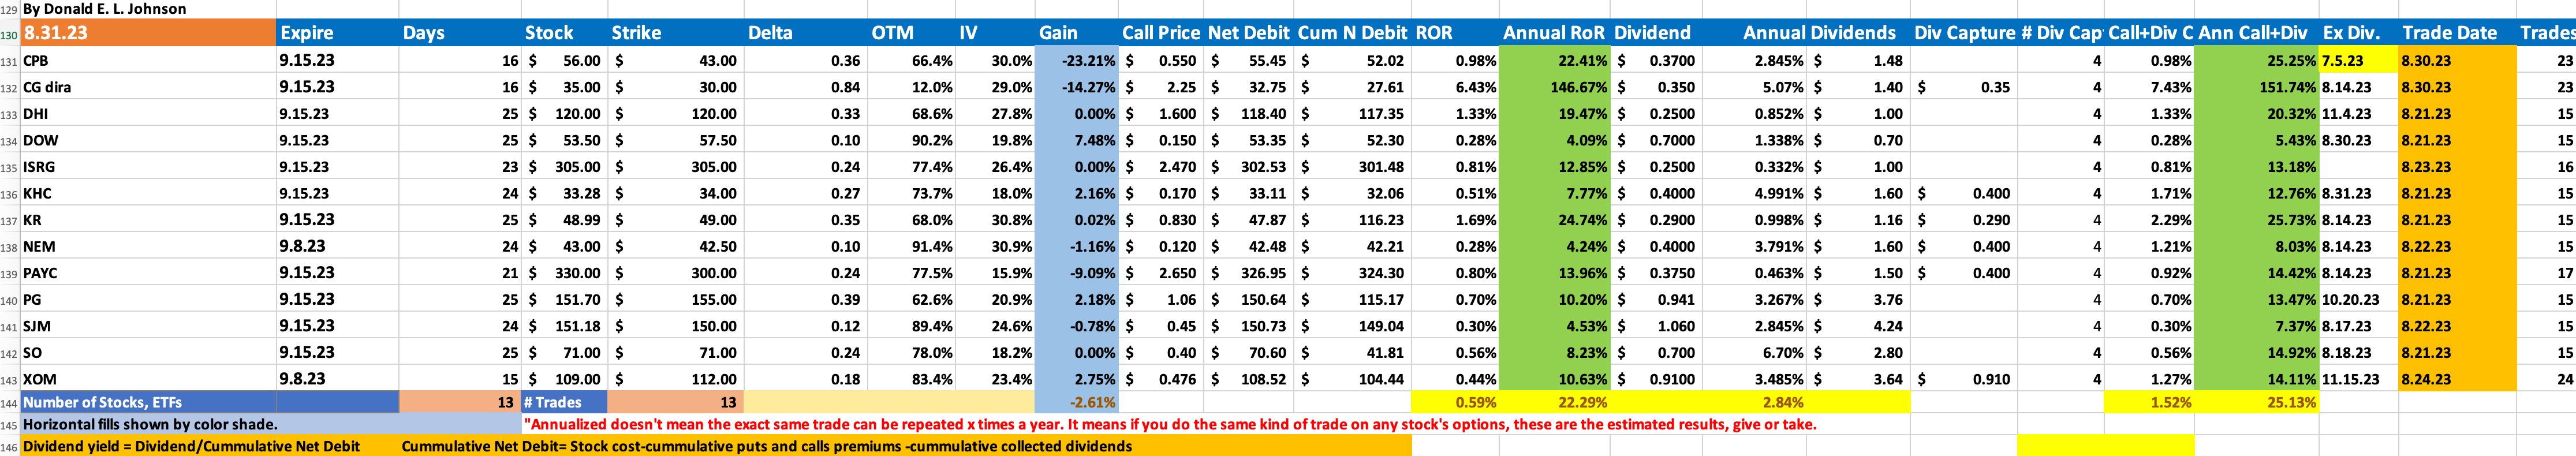
I’ve sold some covered calls at high options prices and close to or at the money (ATM). September’s 0.59% return on risk (RoR) is pretty normal looking. But the 22.29% annualized ROR is distorted by The Carlyle Group (CG) AROR.
Thanks for reading Stock Picking, Options Trading for Income! Subscribe for free to receive new posts and support my work.
These trades anticipate a lower market by September 15 and the high probability that the Fed will maintain, if not raise interest rates later in the month or in November. If some of my losers are called on stock price bounces, I’ll sell puts on them until I can buy them back later in a few months and in time to capture their relatively high dividends.
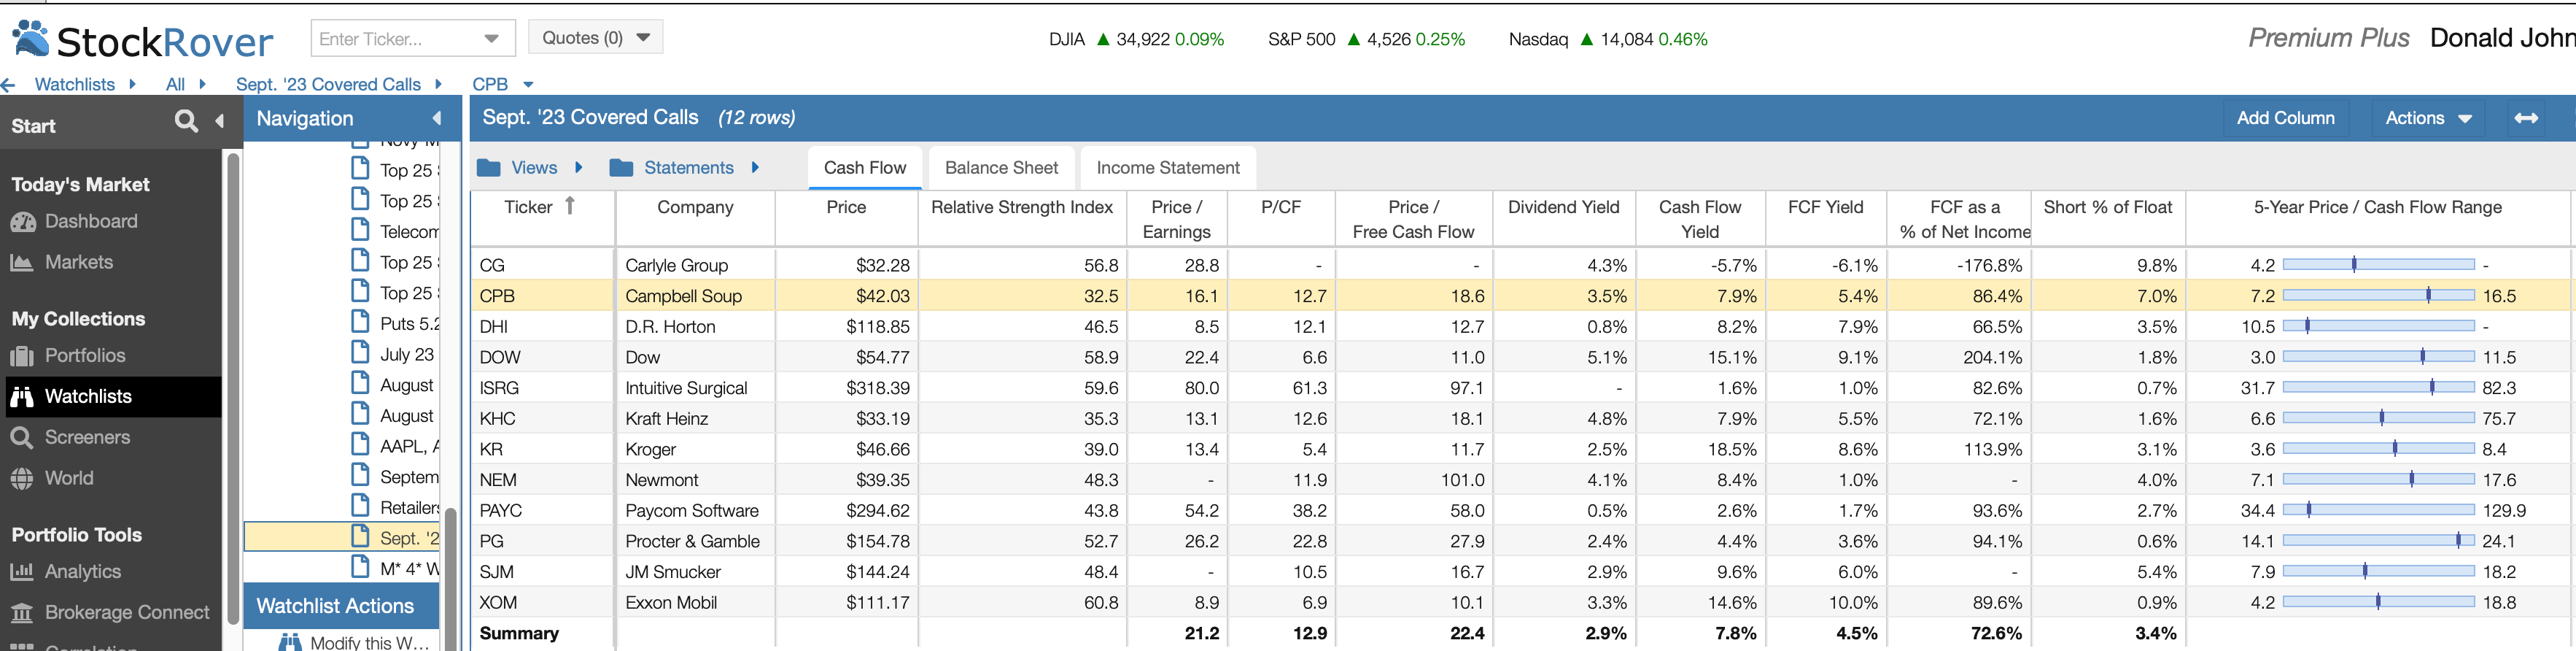
The average price to free cash flow on these stocks is 22.4 times. With a 11.7 P/FCF ratio, Kroger (KR) is the least expensive stock on the list. Newmont Mining Corp’s (NEM) 101 P/FCF ratio is extremely high. It reflects NEM’s high dividend and its huge exposure to the gold and copper markets, which are volatile. Valuentum.com’s fair value estimate on NEM is $48 a share with a possible low FVE of $31 and a high estimate of $65.
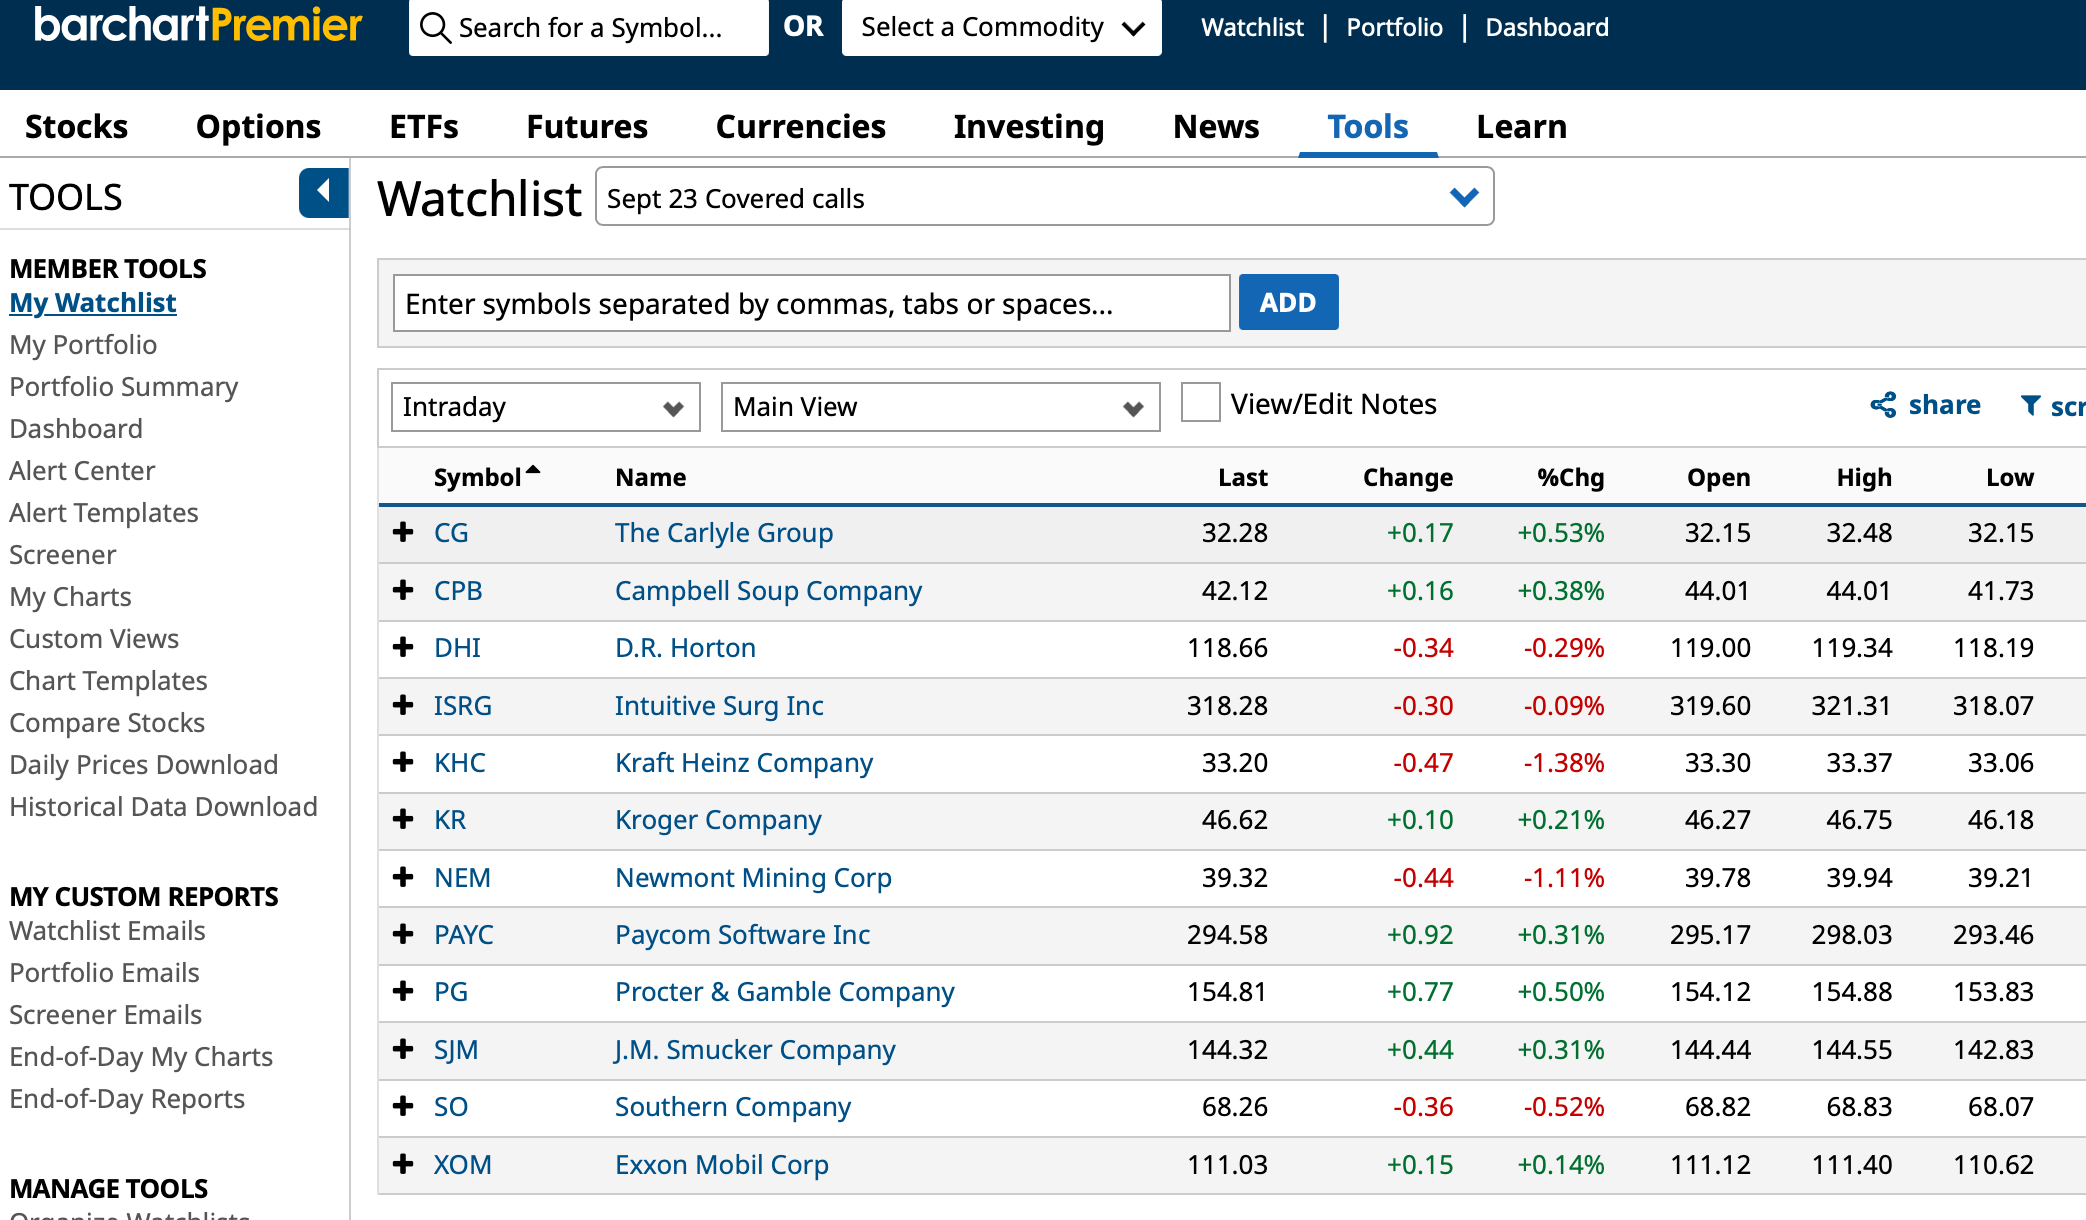
This table shows how the stocks are performing today.
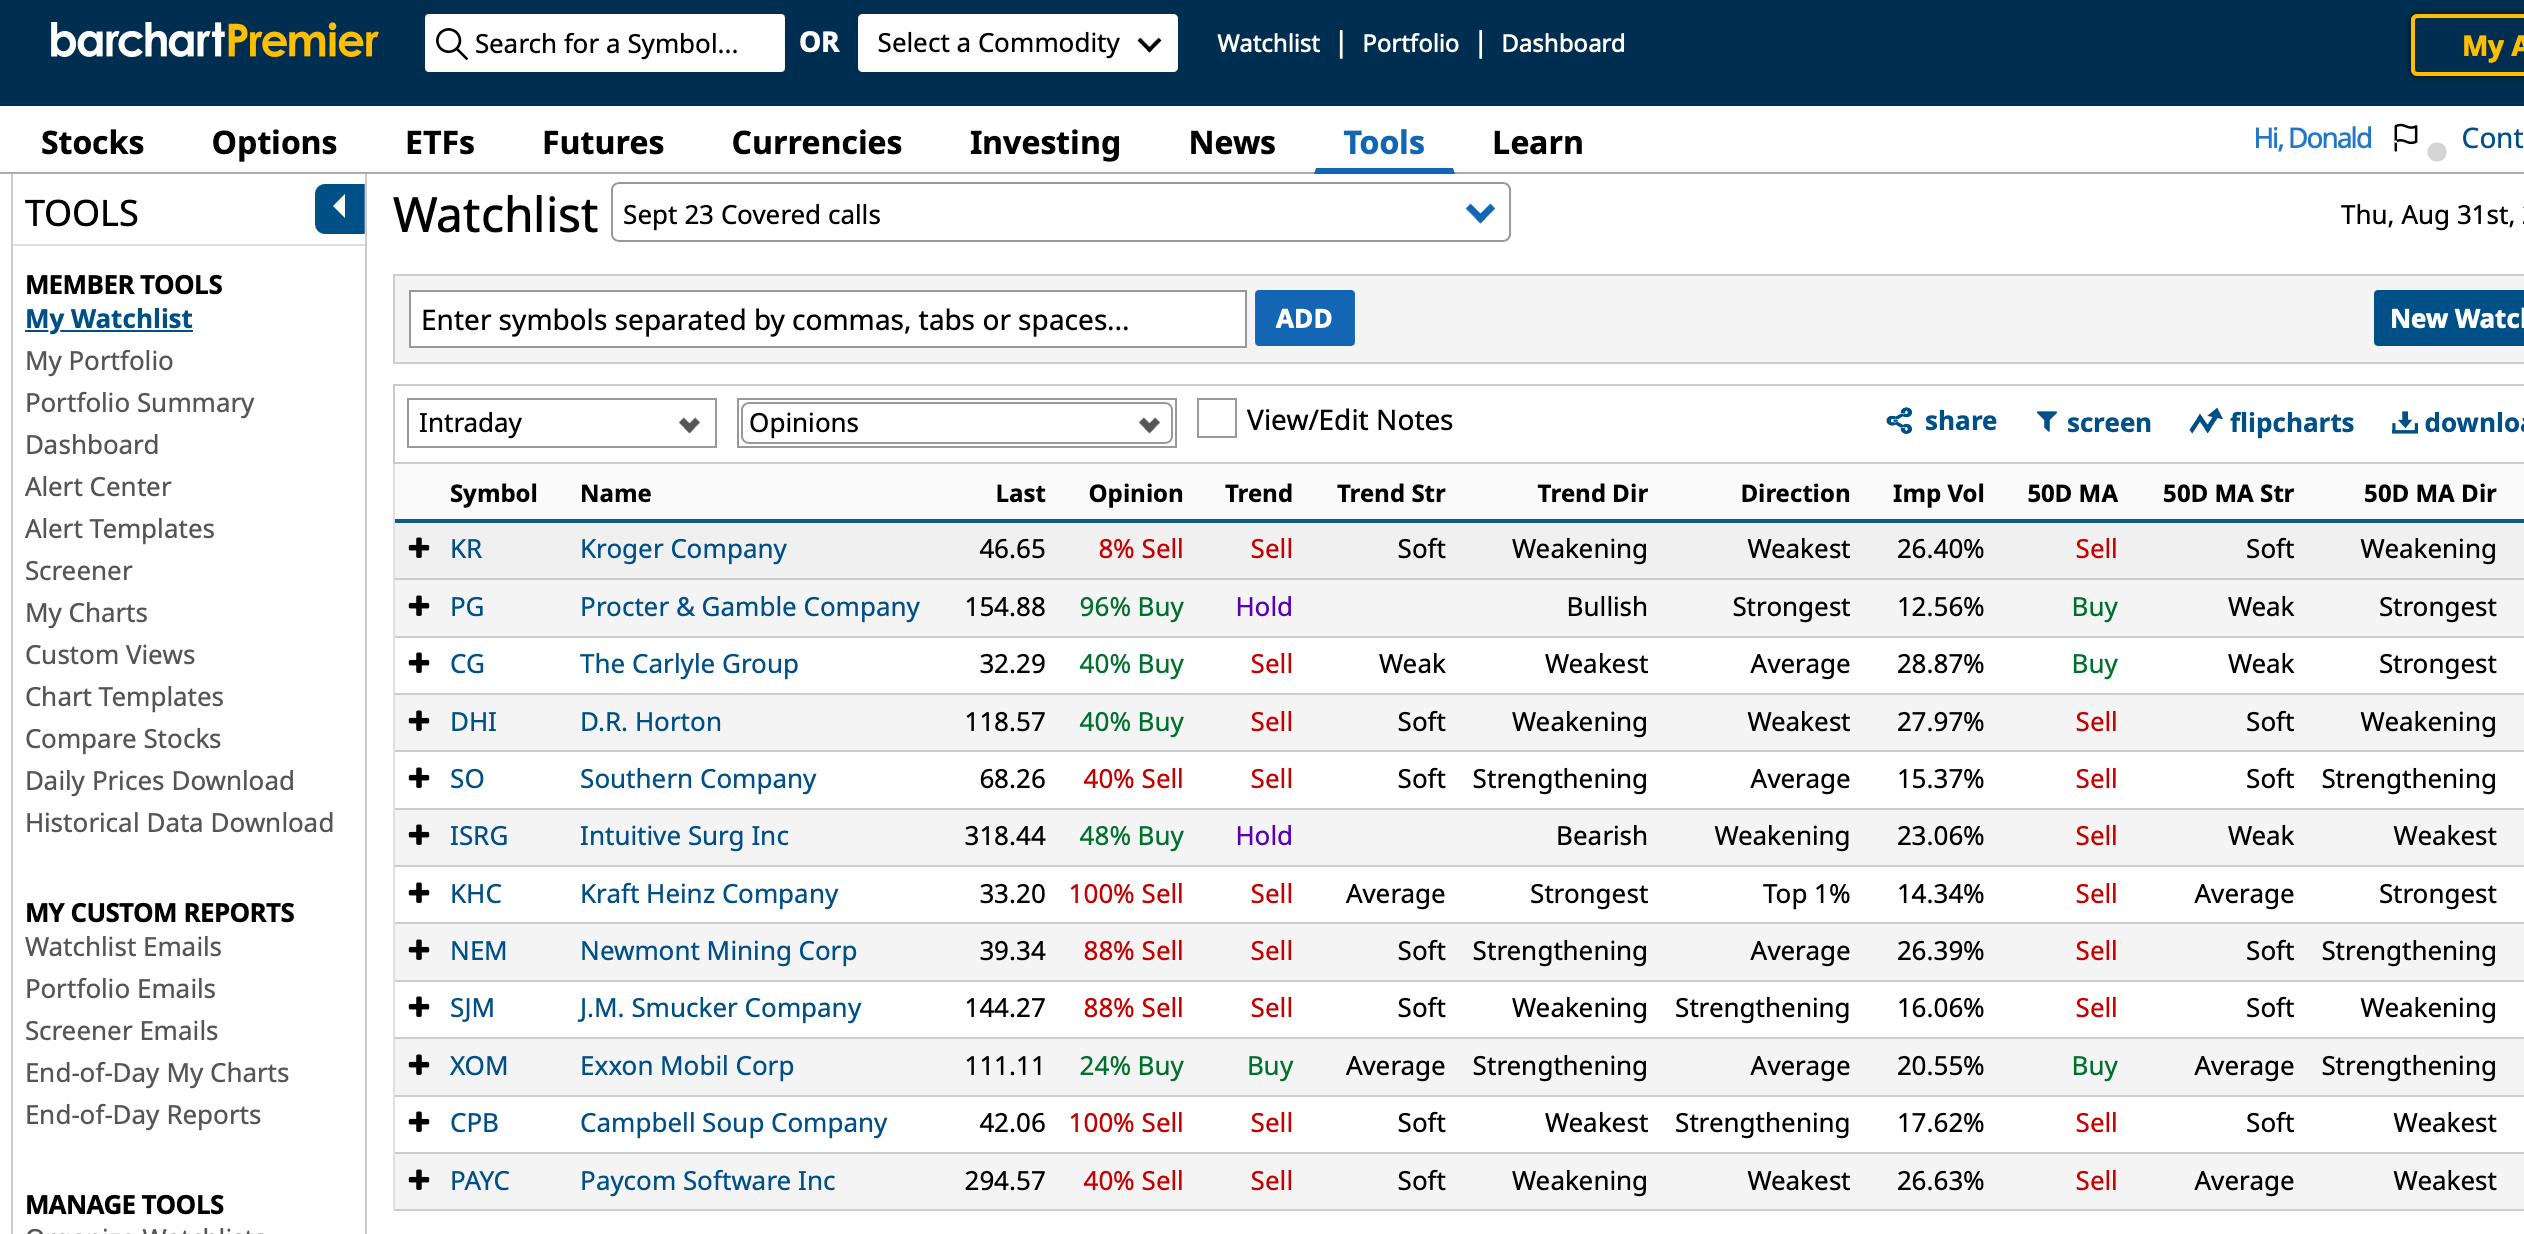
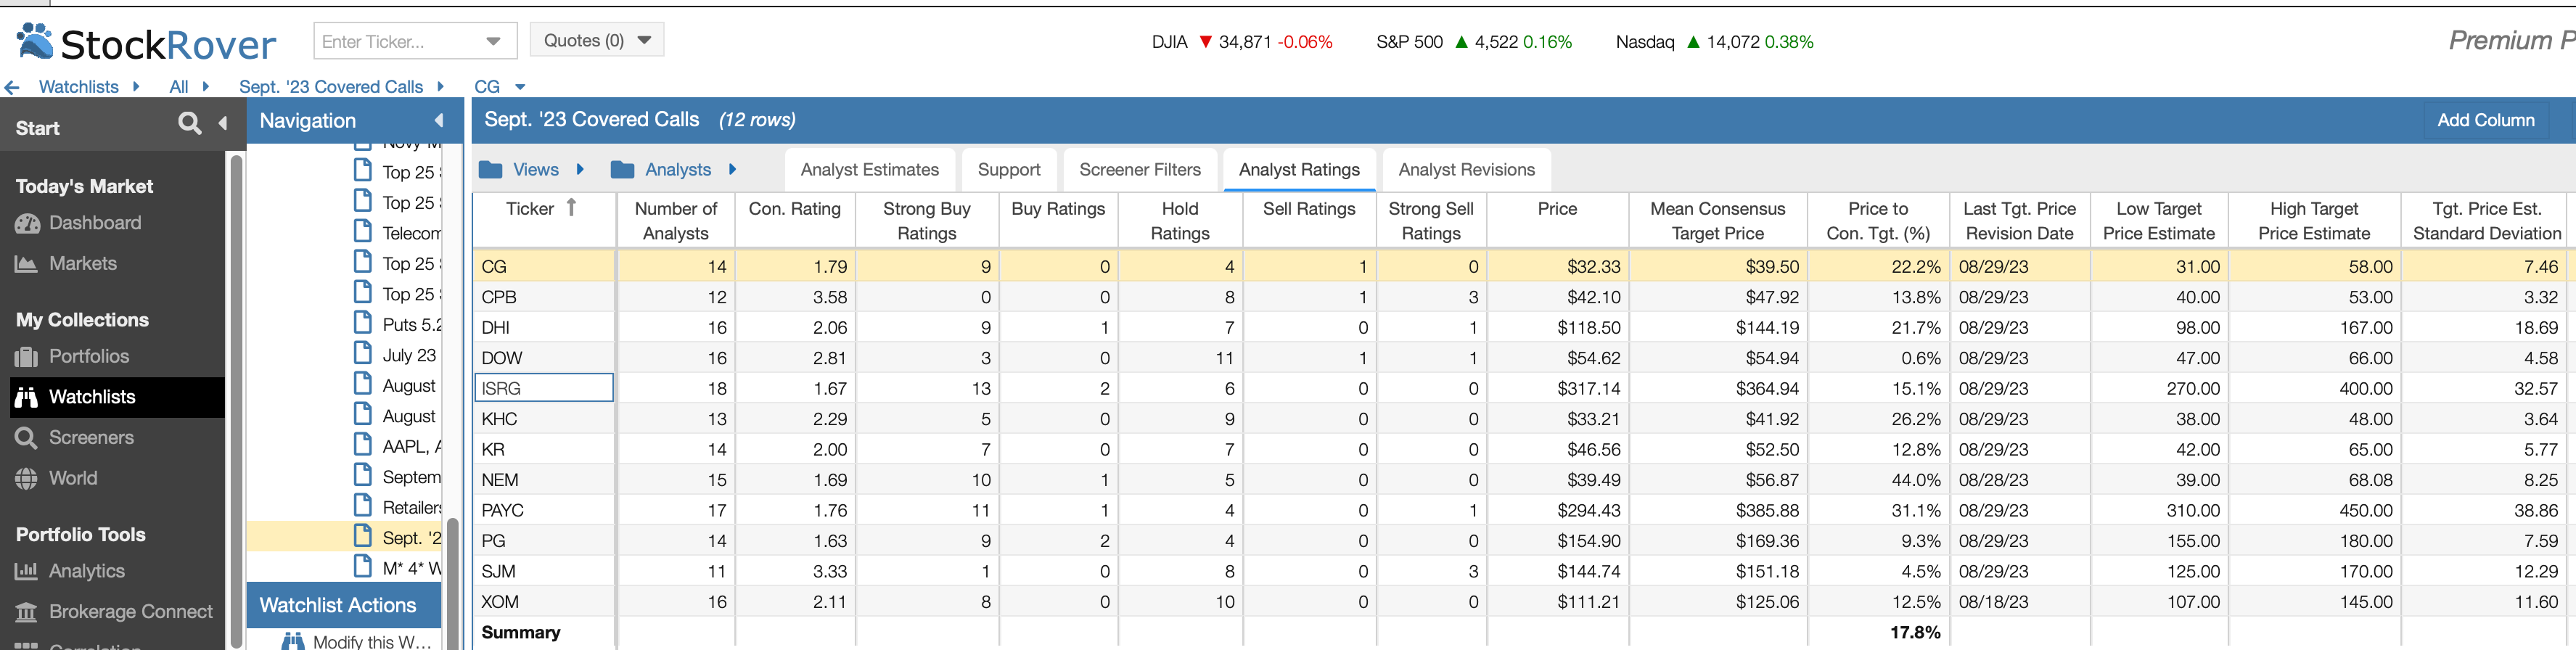
This table shows that Barchart.com’s 13 momentum indicators are flashing sell signals on 7out of 13 of these stocks. That is why it makes sense to sell covered calls closer to the market or at the market.
Stocks with bullish momentum include Proctor & Gamble (PG) , Intuitive Surgical (ISRG) , (CG), D.R. Horton (DHI) and Exxon Mobil (XOM) .
There are sell signals on Kraft Heinz (KHC) , Campbell Soup Co. (CPB) , NEM, Smucker Co. (SJM) , Southern Co. (SO) , Paycom Software Inc. (PAYC) and KR.
On 8.30.23, CPB was at $41.695. My cost was $56. I sold CPB 9.15.25 (16 days) $43 strike covered calls for $0.55. The cumulative net debit after collecting dividends and puts and calls premiums is $52.02. The delta was .36, which means that there is about a 36% probability that CPB will be called. The out of the money (OTM) probability that CPB won’t be called is 66.4%. Valuentum.com’s fair value estimate on CPB is $53 with a scenario range of $41 to $65. Wall Street analysts’ target prices range from a high target price of $53 to a mean of 47.92 and a low TP of $40. They rate the stock a hold.
On 8.30.23, CG was $32.03. My cost was $35. My net debit was $30.21. I sold CG 9.15.23 $30 calls for $2.25. The new net debit is $27.61. Analysts’ high target price on CG is $58, the mean TP is $39.50, and the low TP is $31.
The $30 strike delta was .84, which means the stock is likely to be called. The OTM was 12% and the IV was 29%. The RoR is 6.43%, and the ARoR is 146.67%. CG pays a 5% dividend on my net debit cost. If CG is called, I hope to buy it back at a lower price before it goes ex-dividend again.
Since 8.21.23 when I posted my first September covered calls report, I’ve posted these slightly edited reports on my covered calls trades in that article’s comments section:
8.25.23. PAYC $285.33. Cost $330. Net debit ($330-2.30=$327.70. I sold PAYC 9.15.23 $300 covered calls for $2.65. Net debit ($327.70-2.65= $325.05).
8.23.23. ISRG $291.32. Cost $305. Sold ISRG 9.15.23 (23 days) $305 calls for $2.45 a share. Today ISRG is at $316.83 and the stock could be called early.
ISRG was put to me last week at $305. Less the $1.50, the net debit was $303.50. After selling the September calls, the net debit is $301.48.
The delta on the 23-day trade was .24, OTM was 77.4% and IV was 26.3%.
Analysts' rating is a moderate buy at 4.33 out of 5.
The high analyst's target price is $400, the mean is $364.94 and the lowest TP is $270.
On Barchart.com, ISRG is a weak 8% buy.
8.22.23. SJM closed Tuesday at $139.67 a share. My cost was $151.18.
I sold SJM 9.15.23 (24 days to expiration) $150 strike covered calls for $0.45 a share, or $45 per call options contract. The return on risk is 0.30%, or 4.53% annualized. Add the 2.845% dividend on the $149.04 net debit price and the ARoR would be about 7.37% if I could replicate the trade 15 times in the next 12 months. This trade is in an IRA with other high yielding dividend stocks.
The delta is a low .12, which indicates that there is about a 12% probability that SJM will be called on Sept. 15. The probability that the stock will close below the strike price and out of the money is about 89.39%. I don't want SJM to be called so I traded for a lower risk of having called, and that lower risk comes with a lower RoR.
SJM's $1.06 per share went ex-dividend on 8.17.23. I'm in the stock for the dividend and covered calls premiums plus the possibility that it will rally back to the analysts' target prices. That may never happen, but if I can collect a lot of dividends and options premiums, I can get the net debit down to the stock's market price in a few years.
8.22.23. NEM closed Tuesday at $38.60. It cost $43. I sold NEM 9.15.23 (24 days) $42.50 strike covered calls at $0.12 a share. The delta was .10. OTM is 91.49% and implied volatility (IV) was 30.9%.
The net debit is $42.21. The RoR is .28% or 4.24% annualized. Add the 3.791% annual dividend and the potential ARoR is 8.03% in an IRA. NEM went ex dividend on 8.14.22.
NEM is a 100% sell on Barchart.com. Its RSI is an almost over sold 30.58.
Analysts rate NEM a rather strong moderate buy with a 4.31 rating out of a possible 5.
Their high target price is $68. The mean target is $56.87, and the low target is $39, or about where the stock is trading.
I also sold NEM puts because I'd like to lower my average cost and net debit in this dividend stock.
8.22.23. Because KHC looks like a good dividend stock that has liquid puts and calls options, I bought KHC for $33.28 and sold KHC 9.15.23 (24 days) $34 strike covered calls for $0.17 a share.
Return on risk is about 0.51%, or 7.77% annualized. KHC's dividend goes ex-dividend on 8.31.23 at $0.40 per share. Add the 4.991% yield on the stock's $32.06 net debit and the options premium plus the dividend yield about 12.75% annually in an IRA.
If KHC is called at $34, the 1.69% gain on the trade would amount to an AROR of about 25% if I could get the same results on 15 similar trades during the next 12 months.
KHC is very over sold with a relative strength compared with the S&P 500 index of about 20.92. Any RSI under 30 is considered over sold while a 70 RSI is considered over bought.
Analysts give KHC a moderate buy, or 3.71 out of a possible 5 rating. Their highest target price is $48. The mean target is $41.92. The lowest target is $38, which is above the current price.
Between my weekly portfolio updates, I report my thoughts and trades in the comments section of this and other posts.
I respond to comments on the comments section where readers’ comments are posted. That is, if you have a question about this article or other comments, I'll discuss your questions with you in the comments section below this article.
Thanks for reading Stock Picking, Options Trading for Income! Subscribe for free to receive new posts and support my work.
LINKs:
Home Page. See my more than 100 articles on options trading, stocks and watch lists. If you read several of these articles, you’ll learn how my strategies are meant to work. No guarantees. Links to useful web sites are on the lower right corner of the home page. Scroll down.
Follow @RealDonJohnson on twitter.com and FaceBook.com. Or follow me on Substack.com/Notes where my byline is my handle.
September Puts Options Trades Update #1
August Naked Puts Options Trades Yielded About 16% In Options Premiums Annualized
August Covered Calls Options Trades Yielded 14.6% In Options Premiums
September Puts Options Trades on 4 Stocks
September Covered Calls Trades On 4 Dividend Stocks
August Covered And Naked Puts Options Trades Update #3
16 Jim Cramer Stocks Are Up 12% to 205% Year To Date
AAPL, AXP, CAT, CSCO, FDX, HON, ICE, OPRA, TJX Covered Calls Update #1
August Covered Calls Trades On 14 Dividend Stocks Update #2
August Covered Calls Trades On 13 Dividend Stocks Update #1
August Covered Calls Trades On Dividend Stocks Yield 12.2% in Options Premiums
August Covered And Naked Puts Options Trades Update # 2
August Covered And Naked Puts Options Trades On Paycom And Other Stocks Update #1
August Covered And Naked Puts Options Trades Yield About 12.8% In Options Premiums.
How Owners of AT&T, Verizon, T-Mobile Can Use Covered Calls, Dividends To Offset Losses Update #1
Selling in The Money Covered Calls Can Yield Big Annual Returns on Risk. By Donald E. L. Johnson
How to Beat Inflation Tax, Bear Market Tax With Dividend Stocks, Covered Calls, Cash Secured Puts, by Donald E. L. Johnson.
How I Analyze Bullish Puts Options Trades With Stock Rover, By Donald E. L. Johnson.
Wars Breed Inflation, Rising Interest Rates, Market Turmoil, By Donald E. L. Johnson.
Calls vs Puts Options: What’s the Difference?
A video on how to place options trades on TDAmeritrade.com’s Think or Swim trading platform.
On the date of publication, Donald E.L. Johnson had a position in: CPB, CG, DHI, DOW, ISRG, KHC, KR, NEM, PAYC, PG, SJM, SO, XOM. All information and data in this article is solely for informational purposes. For more information please view the Barchart Disclosure Policy here.
