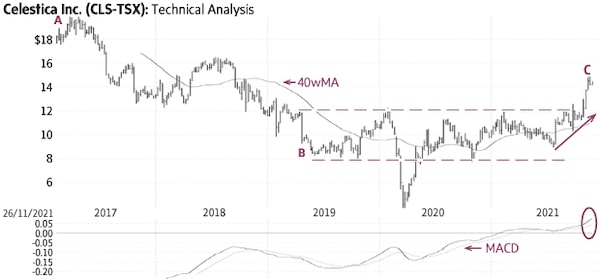
Celestica Inc. (Friday’s close $13.84) declined from $19.94 in April, 2017, to $8.26 in June, 2019 (A-B), and then stayed in a horizontal trading range mostly between $7.50 and $12.00 (dashed lines).
The recent rise above the top of this range signalled a breakout and the start of an uptrend toward higher targets (C).
Behaviour indicators including the rising 40-week Moving Average (40wMA) and the rising trend-line (solid line) confirm the bullish status. A minor correction toward $13 would provide a good entry level. Only a sustained decline below $11.50-$12.00 would be negative.
Point & Figure measurements provide an initial target of $16. Higher targets are visible.
stock
Monica Rizk is the senior Technical Analyst and Ron Meisels is the president of Phases & Cycles Inc. (www.phases-cycles.com). And he tweets at @Ronsbriefs. They may hold shares in companies profiled.
Chart source: www.decisionplus.com
Be smart with your money. Get the latest investing insights delivered right to your inbox three times a week, with the Globe Investor newsletter. Sign up today.
 Monica Rizk
 Ron Meisels