stock
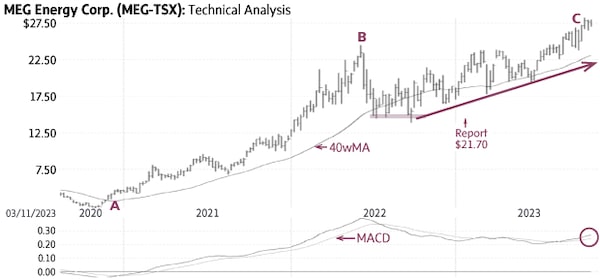
On Feb. 2, 2023, ($21.70) we identified a major up-leg (A-B), a correction to $14.50-15.00 (shaded area) and suggested that a rise above $21-22 would support targets of $25 and $27.
MEG Energy Corp. MEG-T had a series of highs and lows above a rising trend line (solid line) and reached a recent high of $28.42 for a 31-per-gain since our report (C).
Behaviour indicators including the rising 40-week Moving Average (40wMA) and the rising trend line confirm the bullish status. There is good support near $24-25; only a sustained decline below the 40wMA (currently near $23) would be negative.
Point & Figure measurements provide targets of $29 and $33. Higher targets are visible
Monica Rizk is the senior technical analyst of the Phases & Cycles publication (www.capitalightresearch.com). Chart source: www.decisionplus.com
Be smart with your money. Get the latest investing insights delivered right to your inbox three times a week, with the Globe Investor newsletter. Sign up today.
 Monica Rizk