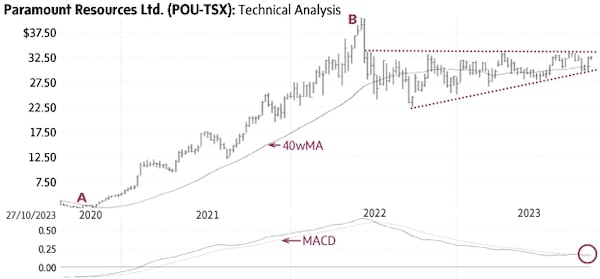
Paramount Resources (Wednesday’s close $32.72, POU-T) rallied from $1.96 in October 2020 to $40.73 in June 2022 (A-B) above the rising 40-week Moving Average (40wMA). The stock then settled in a large corrective wedge pattern made up of higher lows and resistance near $33 (dotted lines). A sustained rise above $34-35 would signal a breakout from the wedge and the start of a new uptrend toward higher targets.
Behaviour indicators including the rising 40wMA confirm the bullish status. There is good support at the average (currently near $30); only a sustained decline below this level would be negative.
A rise above $34-35 would signal Point & Figure targets of $39 and $43. Potentially higher targets are visible.
stock
Monica Rizk is the Senior Technical Analyst of the Phases & Cycles publication (www.capitalightresearch.com). Chart source: www.decisionplus.com
Be smart with your money. Get the latest investing insights delivered right to your inbox three times a week, with the Globe Investor newsletter. Sign up today.
 Monica Rizk