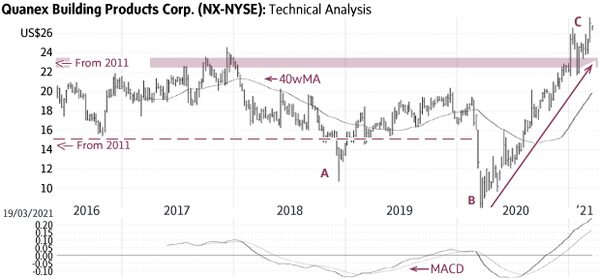
Quanex (Friday’s close $26.42) ran into resistance at $22-23 for about ten years (shaded area). During this time, the stock found support at ±$15 (dashed line), except for three temporary dips: 2011 (not shown), 2018 (A) and 2020, “flash crash” (B).
Following the “flash crash” last March (B), Quanex started a powerful rise that cut through resistance of the past ten years to reach an all-time high of $27.81 (C). This price action signalled a major breakout and the start of a new major up-trend toward higher targets.
Behaviour indicators including the rising 40-week Moving Average (40wMA) and the rising trend-line (solid line) confirm the bullish status. Quanex is somewhat overbought, but there is good support near $22-23. Only a sustained decline below $20 would be negative.
Point & Figure measurements provide targets of $29 and $32. Higher targets are visible.
stock
Monica Rizk is the senior Technical Analyst and Ron Meisels is the president of Phases & Cycles Inc. (www.phases-cycles.com). And he tweets at @Ronsbriefs. They may hold shares in companies profiled.
Chart source: www.decisionplus.com
Be smart with your money. Get the latest investing insights delivered right to your inbox three times a week, with the Globe Investor newsletter. Sign up today.
 Monica Rizk
 Ron Meisels