This week I am planning a long Natural Gas butterfly and a short Cocoa calendar spread for client and personal account.
SpreadEdge Capital specializes in seasonal spread trading across a wide variety of commodity markets. A spread trade is the simultaneous purchase and sale of the same commodity with different delivery dates or of related commodities with the same or different delivery dates. SpreadEdge publishes a weekly Newsletter that provides several seasonal spread trade opportunities every week.
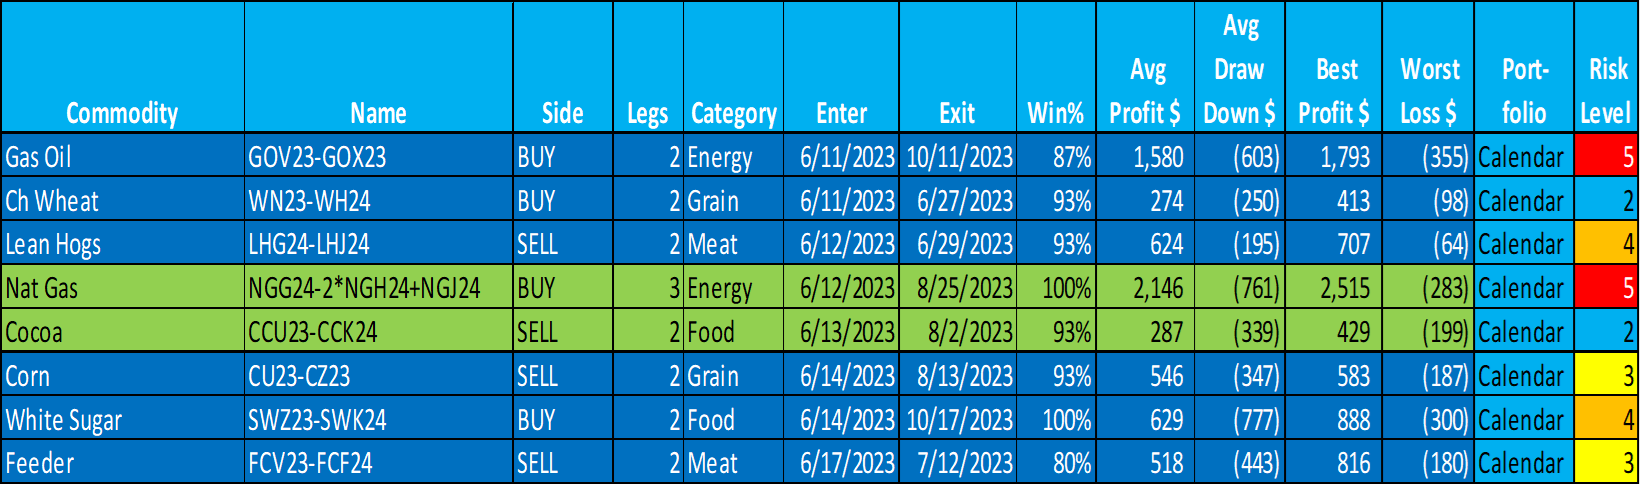
Watch List
Every SpreadEdge Newsletter includes a “Watch List” of trades that meet our strict screening criteria. Included in the Watch List are the markets, commodity symbols, entry and exit dates, win %, average profit, average drawdown, best profit, worst loss, and risk level (using a 1-5 scale). All information is based on the most recent 15 years of historical data.
This week there are 2 trades on the Watch List that I am planning for client and personal accounts. This article will focus on the short Cocoa calendar spread. (Please note the hypothetical disclaimer at the bottom of this article).
Commodity Outlook Summary
In addition to the technical action, there are several indicators on my Commodity Outlook that caught my eye. This page shows the summary page that is included in my weekly Newsletter. The Commodity Outlook includes weekly price change, seasonality, COT or commitment of traders, relative positioning, CTA positioning, relative strength, and commodity carry and roll.

The Cocoa trade checks almost every box on the Commodity Outlook summary page.
Here are the items that jump out at me :
- Daily price action
- Seasonality
- Commitment of Traders
- Relative Price and Positioning
- CTA momentum
- Relative Strength Index
I will review each of these indicators in more detail on the following pages.
Technical Action
Cocoa gained 5.1% last week while breaking out to new highs. The Relative Strength Index closed over 74 and is firmly in reversal territory.

Seasonality
Seasonality data is generated by SeasonAlgo. Entry and exit dates are analyzed and scored for every expiration month combination. Scores are based on a proprietary formula that considers average profit, drawdown and win % over the most recent 15-year period. Negative values indicate “sell”; Positive values indicate “buy”. The higher the value, the stronger the historical seasonality.

Cocoa has a solid bearish seasonality score of (73) for next week. In addition, seasonality continues to be bearish for trades entering over the next 3 to 4 weeks. Scores in this range indicate an excellence balance of historical average profitability compared to average drawdowns.
Commitment of Traders Data
COT is generated by Peak Trading Research. Hedge funds are the price drivers in the agriculture markets, Peak uses machine learning algorithms to provide daily fund position estimates and context around how extended long (red) or extended short (green) the funds are.

Cocoa is very near the maximum 100 “Net Position Percentile” for both Non-Commercial and Managed Money Hedge Funds.
Relative Price and Positioning
Relative Positioning – Oversold versus Overbought on the horizontal axis. COT current net position compared to the COT data over the past 24 months.
Relative Price - Cheap versus Expensive on the vertical axis. A comparison of the front month current price compared to the front month price over the past 24 months.

Cocoa continues to be amongst the most “Overbought and Expensive” markets in the Ag complex. Markets can stay elevated in relative price and position for extended periods, however, the other indicators presented points to Cocoa returning to more normal levels.
CTA Momentum
The CTA Momentum Score is an accurate measure of current momentum and trend-following trader positioning using a (+10 / -10 scale). Momentum and trend following traders represent a large percentage of trading and can move markets significantly higher or lower.

Note that Cocoa has a maximum 10 score indicating that CTAs are fully invested and have little trading capital to add to existing longs. Note also that the RSI score is 72 and amongst the strongest in the ag complex. Scores in excess of 70 have a high likelihood of reversal.
Mean Reversal
Non-Commercial traders have a record leg of 109,077 contracts of Cocoa. This massive gross long leg sends a strong bearish signal. Prices have dropped after similar fund positioning in 2014 and 2018 in 12 out of 12 three-month periods after (table below). Cocoa is the #1 mean reversing commodity market which suggests that prices will revert to the long-term mean or average level.

Spread Chart
A quick look at the spread charts indicates a good set-up for this trade. Note that the current price, represented by the black line, is consistent with the 5-year and 15-year historical patterns (represented by the red and blue lines).

To trade Coca, I will sell the September 23, May 24 calendar spread. THe optimal entry day is Tuesday but any day this trading week will work.
BTW, for more information on spread charts, the video on my website “SpreadEdgeCapital.com” has a video entitled “Anatomy of a spread trade".
Videos
For a video of this trade.
To subscribe to the Newsletter.
For a FREE eBook about the SpreadEdge seasonal spread strategy.
More Information
The SpreadEdge Weekly Newsletter is published every weekend and provides a broad overview of the important seasonal, technical, and fundamental indicators within the Energy, Grains, Meats, Softs, Metals and Currency markets. In addition, spread trade recommendations and follow-up on open trades is also provided. For a free copy of the Weekly Newsletter, please send an email to info@SpreadEdgeCapital.com
Darren Carlat
SpreadEdge Capital, LLC
(214) 636-3133
Darren@SpreadEdgeCapital.com
Disclaimers
SpreadEdge Capital, LLC is registered as a Commodity Trading Advisor with the Commodity Futures Trading Commission and is an NFA member. Past performance is not indicative of future results. Futures trading is not suitable for all investors, The risk associated with futures trading is substantial. Only risk capital should be used for these investments because you can lose more than your original investment. This is not a solicitation.
HYPOTHETICAL PERFORMANCE RESULTS HAVE MANY INHERENT LIMITATIONS, SOME OF WHICH ARE DESCRIBED BELOW. NO REPRESENTATION IS BEING MADE THAT ANY ACCOUNT WILL OR IS LIKELY TO ACHIEVE PROFITS OR LOSSES SIMILAR TO THOSE SHOWN. IN FACT, THERE ARE FREQUENTLY SHARP DIFFERENCES BETWEEN HYPOTHETICAL PERFORMANCE RESULTS AND THE ACTUAL RESULTS SUBSEQUENTLY ACHIEVED BY ANY PARTICULAR TRADING PROGRAM. ONE OF THE LIMITATIONS OF HYPOTHETICAL PERFORMANCE RESULTS IS THAT THEY ARE GENERALLY PREPARED WITH THE BENEFIT OF HINDSIGHT. IN ADDITION, HYPOTHETICAL TRADING DOES NOT INVOLVE FINANCIAL RISK, AND NO HYPOTHETICAL TRADING RECORD CAN COMPLETELY ACCOUNT FOR THE IMPACT OF FINANCIAL RISK IN ACTUAL TRADING. FOR EXAMPLE, THE ABILITY TO WITHSTAND LOSSES OR TO ADHERE TO A PARTICULAR TRADING PROGRAM IN SPITE OF TRADING LOSSES ARE MATERIAL POINTS WHICH CAN ALSO ADVERSELY AFFECT ACTUAL TRADING RESULTS. THERE ARE NUMEROUS OTHER FACTORS RELATED TO THE MARKETS IN GENERAL OR TO THE IMPLEMENTATION OF ANY SPECIFIC TRADING PROGRAM WHICH CANNOT BE FULLY ACCOUNTED FOR IN THE PREPARATION OF HYPOTHETICAL PERFORMANCE RESULTS AND ALL OF WHICH CAN ADVERSELY AFFECT ACTUAL TRADING RESULTS.
On the date of publication, Darren Carlat had a position in: CAU23. All information and data in this article is solely for informational purposes. For more information please view the Barchart Disclosure Policy here.

