IBM Elliott Wave Analysis-Unraveling the Recovery Ahead
(IBM) , founded in 1911, is a global technology leader known for pioneering innovations in computing. From tabulating machines to AI and quantum computing, IBM has consistently shaped the tech landscape, providing cutting-edge solutions for businesses worldwide. IBM stock is listed on the New York Stock Exchange NYSE. In this blog post, let's do the IBM Elliott wave analysis. This can help us understand the long-term and near-term dynamics of this stock.
The IBM stock fell together with the US stock markets and has thus shed over 16% between 03.12.24 and 05.03.24. However, there is barely a 2% net gain in 2024 as almost all of the profits are now gone. How soon can a real recovery begin or how deeper can the sell-off go? This blog post seeks to answer that from our Elliott wave perspective. Let’s start the analysis from the monthly chart.
IBM Elliott Wave Analysis - Monthly Chart. May 2024

On the monthly chart, we could capture the price history of IBM since 1970. Between that time, when the stock was barely exchanged for $16, and March 2013 when it reached its all-time high at just over $206, the chart completed a 5-wave impulse sequence. Notably, the impulse wave was of the grand supercycle degree. What followed afterward was a sell-off that lasted 7 years. The 7-year corrective bearish cycle ended in 2020 at $86.5 to complete wave (II) of the grand super cycle degree.
Since then and four years later, the stock rallied close to an all-time high as part of wave I of (I) of ((III)). The current pullback from March should be the wave ((4)) of I. The implication of this is that once wave ((4)) completes, there should be a recovery for ((5)) before a bigger pullback for II begins. However, wave ((4)), after completion, must be contained above 153.2 wave ((1)) high.
IBM Elliott Wave Analysis - Monthly Chart - Alternate Outlook. May 2024
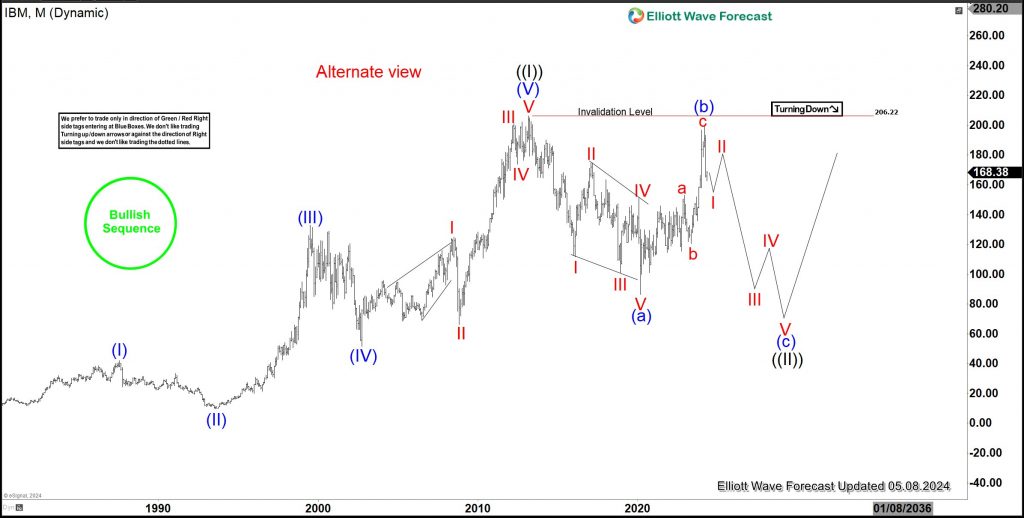
However, alternatively, if wave ((II)) grand supercycle degree has not ended, the current decline should continue as wave (c) of ((II)). This could last for several years. This is one scenario to take note of. However, we will go with the first scenario because the bullish cycle in the US stock markets is not over yet.
IBM Elliott Wave Analysis - H4 Chart. May 2024.

The 4-hour chart shows that wave ((4)) has been completed with a double zigzag structure at the extreme. Price has bounced as a result. A bullish impulse should emerge as the price separates from the blue box. Alternatively, if the bounce completes a corrective 3,7 or 11 swings instead of an impulse, there is the possibility of it returning lower to complete a lower ((4)). However, that increases the risk of invalidating the primary degree impulse as ((4)) can cross below 153.32. If that's the case, we may have to adopt the alternative scenario.
Source: https://elliottwave-forecast.com/stock-market/ibm-elliott-wave-analysis-unraveling-recovery-ahead/
On the date of publication, Elliott Wave Forecast did not have (either directly or indirectly) positions in any of the securities mentioned in this article. All information and data in this article is solely for informational purposes. For more information please view the Barchart Disclosure Policy here.

