Gold and USD Index Break Higher Together – What Gives?
Gold’s moving higher and… the USD Index is moving higher as well, which one is faking it?
In the recent past I commented on gold’s performance as being similar to what we saw in 2011. Today’s move higher makes the similarity less clear, but still intact.

As a reminder, back in 2011, gold consolidated for over 40 days, then it rallied sharply, and formed a double top, with the second top being slightly higher.
Right now, gold is after over 40 days of consolidation, a sharp rally, and a double top, with the second top being slightly higher.

The huge volume accompanied analogous days, so the similarity is very much intact.
Now, did today’s pre-market rally change it all?

Gold price just moved slightly above the previous high and now it’s moving back toward it.
The move to new highs looks really important but… The strong link to 2011 suggests that extreme caution is warranted.
History doesn’t have to repeat itself to the letter! It can simply rhyme. Instead of a double top with the second higher high, we could just as well see a triple top with increasing highs. This would still be very similar to what we saw in 2011.
Putting the link to 2011 aside for a while, please note that gold’s move is not confirmed as it moved to new highs just a few hours ago.
At the same time… gold’s arch-nemesis, the USD Index is also breaking higher!
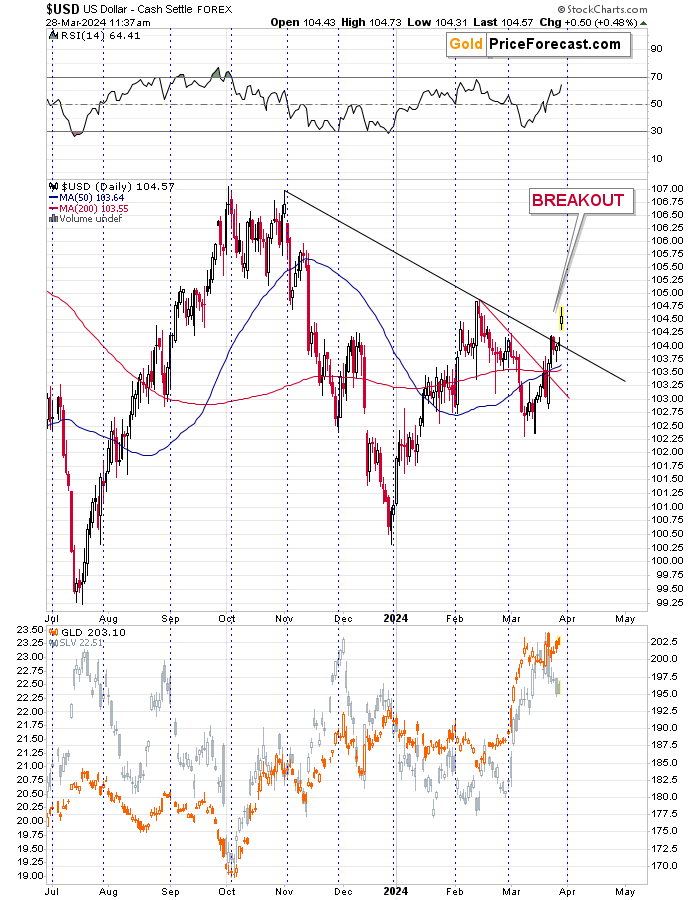
After a fake post-Fed decline, the USD Index soared back with vengeance, and it’s already above its declining, medium-term resistance line. With this kind of strength, the U.S. currency is likely to trigger more declines in gold, and the latter is likely to catch-up with its reaction to what the USD Index has been doing.
More importantly, though, the USD Index is above its declining long-term resistance line! It just moved above it.
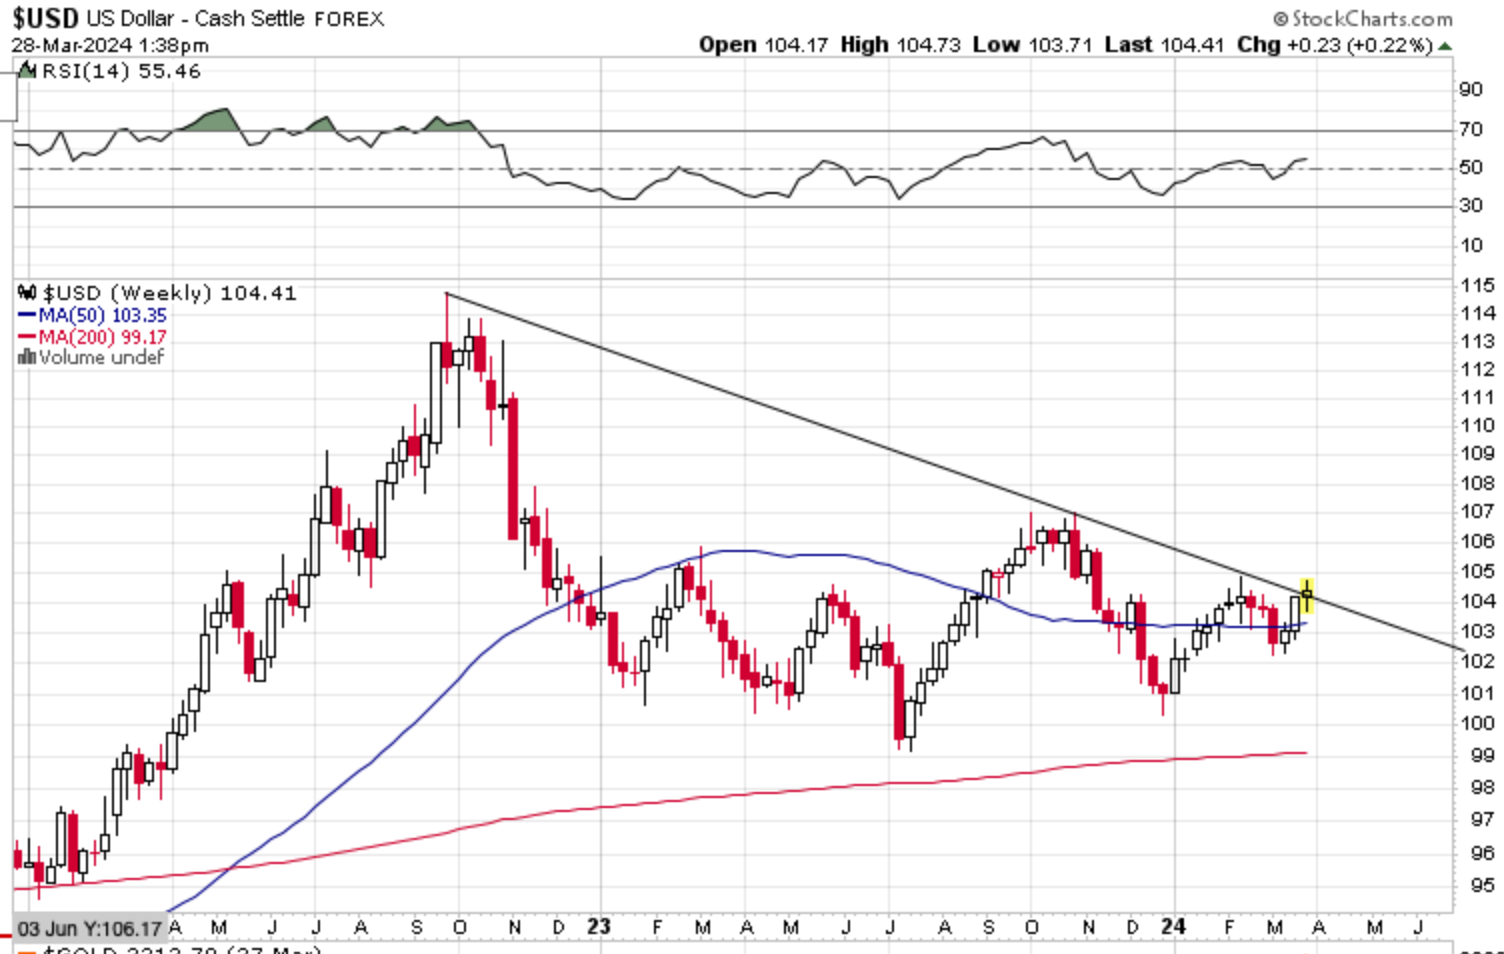
That was the last thing stopping the USD Index from rallying in a huge way – and this line was just broken.
Yup, it’s a breakout.
Now, why is gold rallying along with the USD Index? Does it make any sense? Do the technical analysis techniques no longer apply?
Of course they do! They are based on fear and greed and nothing that happened made investors stop having or reacting to those emotions. Thus, the technical rules apply – they just work most of the time, they will never work each and every time. Which is why I’m covering so many charts and I’m applying so many different techniques – to see what confirms a given outlook and what doesn’t to push the odds in our favor.
So, why are the USD Index and the price of gold rallying together here?
It’s the yen.
Based on Bank of Japan’s recent rate hike, the situation in yen started to change. Theoretically is bearish for gold as it will be less profitable to borrow yen to buy gold (one could do that and even get paid for it due to negative interest rates), but in practice it caused a commotion on the currency markets.

The yen is on the verge of breaking to new multi-year lows, and it seems that the traders are betting against this move.
And yet… If you focus on the two situations in the yen that are similar based on the moves in the RSI (mid-2002 and mid-2023) that I marked with red ellipses, it turns out that after a short-term rally, there comes a bigger decline. We already saw that short-term rally.
This is on top of what I wrote about yen last week:
“The announcement of the week award goes to BoJ that just hiked rates for the first time in 17 years. Not without impact on gold.
In the aftermath of the decision the Japanese yen fell in value, which might seem surprising unless one knows about the specific way in which the markets react to news.
The market moves on rumor and then moves back when something does indeed take place. The move by the BoJ had been widely communicated before it took place, so every could have prepared. The yen rallied based on that. And when the rates were raised, the yen moved back down.
This is interesting from both: fundamental and technical point of view. Let’s start with technicals first.
The yen is on verge of breaking to new lows. The 2023 attempt resulted in a countertrend rebound, and the early 2024 attempt resulted in a much smaller rebound. This time, the yen likely doesn’t have enough strength to bounce back in any meaningful way, and it seems that it’s going to sink.
The RSI based on it confirms that. Due to the recent sharp upswing, the RSI moved very close to the 70 level, and those cases very often marked local tops for the Japanese currency. The shape of the recent upswing in both: yen and the RSI are particularly similar to two cases from the recent past: the mid-2022 rally and the mid-2023 rally. Also, in both cases, yen moved slightly above its 50-day moving average.
In both above-mentioned cases, yen then declined significantly.
Now, the most interesting thing for us – gold & silver investors and traders – is that the tops in yen were usually aligned[approximately – the areas marked in red show details] with tops in gold – or the tops in yen preceded tops in gold. I marked the moments when RSI moved to 70 or close to it with vertical, dashed lines, and I marked those lines with colors depending on the follow-up action in gold.
In seven out of nine cases, gold then declined either immediately or soon. Since we saw the sell signal from yen’s RSI once again, things don’t look good for the yellow precious metal.
From the fundamental point of view, the situation is also interesting and bearish for gold. We just saw the last of the world’s monetary authorities ending the negative interest rate policy.
This means that beforehand, it was possible to borrow one of world’s main currencies, make some money thanks to borrowing that currency and using it to buying gold. Pretty sweet deal, right? Especially if you apply enormous leverage as the big banks often do.
This deal just stopped being so lucrative. If the rates move even higher, it might cease to be beneficial at all. But the key thing already happened – there is no more the possibility to get free money and then use it to buy gold.
Technicals confirm what fundamentals justify.”
The situation in the EUR/USD suggests that the USD Index is going north – in this case the yen’s currency exchange rateagainst the USD might be the last domino to fall.

The areas marked with red ellipses are analogous. It’s common for the EUR/USD to provide one last bounce before it plunges after its multi-top pattern. In other words, the outlook here remains bearish which has bearish implications for the precious metals market.
So, will gold rally despite being extremely overbought and regardless of its 2011 price pattern, or will the last forexdomino (yen) fall as the USD Index soars pushing gold, yen, and the euro lower? The latter seems more probable.
Thank you for reading my today’s free analysis. We're on a record of twelve profitable trades in junior miners (long and short) in a row and the current trade is likely to be closed profitably as well. I encourage you to get more updates from me and other gold experts through our free gold newsletter - sign up now.
Przemyslaw K. Radomski, CFA
Founder, Editor-in-chief
On the date of publication, Przemyslaw K. Radomski did not have (either directly or indirectly) positions in any of the securities mentioned in this article. All information and data in this article is solely for informational purposes. For more information please view the Barchart Disclosure Policy here.
