How I'm Trading The Gold Rally With Newmont Covered Calls, Cash Secured Puts Stock Options
By Donald E. L. Johnson
Cautious Speculator
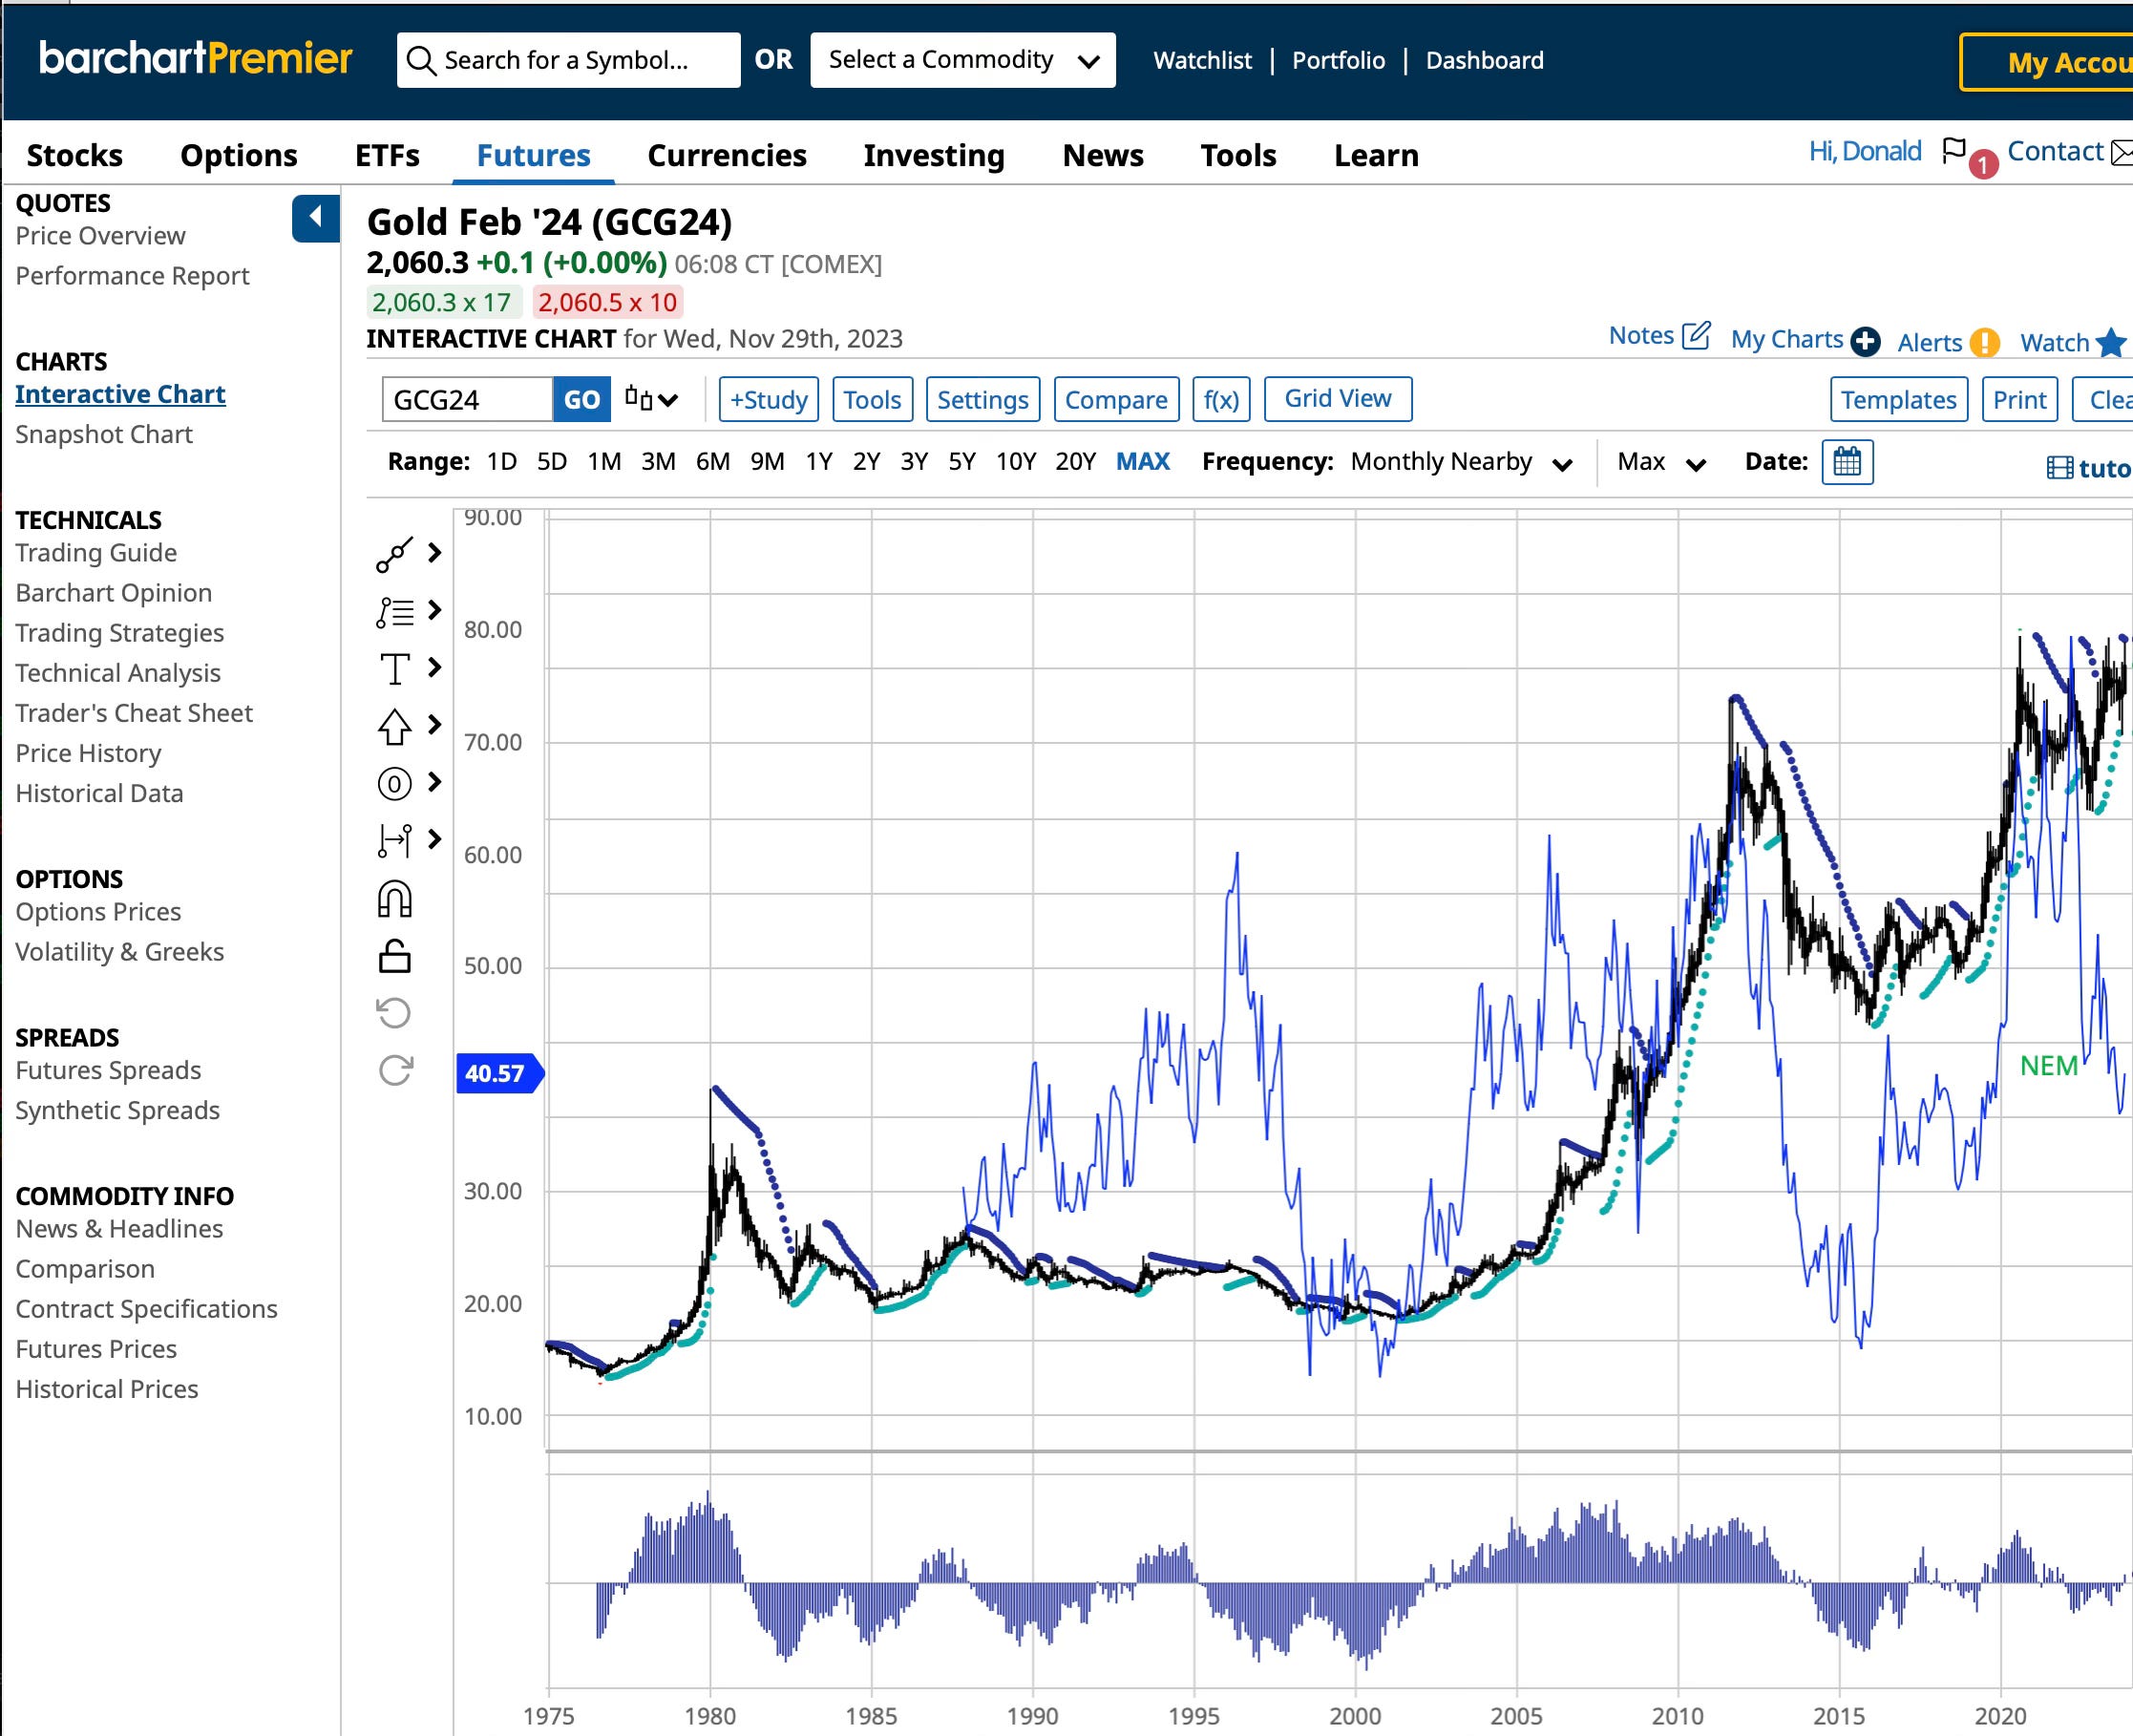
- Gold futures (Feb ‘24) were up 1.9% in the last 5 days. The 52-week range was $1,842 to $2,140.
- NEM is up 7.11% in the last five days. It’s 52-week low was $33.58 and its 52-week high was $60.08.
- This post discusses my 20 NEM puts and calls trades so far this year. Options premiums plus capital gains and NEM dividends are giving me more than a 26% annualized return on risk.
Gold (GCG24) is breaking out a nearing a new high, boosting my Newmont Mining Corp. (NEM) to $40.57 Tuesday. It is down a bit after going ex-dividend on Nov. 29.
Please click on images and zoom in for better views.
At 12 a.m., January 1,1975, I was on the floor of the Chicago Board of Trade, to watch the opening of its new ill-fated gold futures market in a special trading session. The CBOT, Comex and two other exchanges opened gold futures markets on the first day it was legal for Americans to own and trade gold. The CBOT and Comex exchanges are owned by CME Group Inc. (CME). It had been illegal to own or trade gold in the U.S. for the previous 42 years.
To me, gold futures is a market used by speculators the way they trade bitcoin, grains and other speculative futures markets. NEM and other producers and industrial users of precious metals hedge their gold, silver, copper and other metals inventories on the futures markets which are too risky for me. A lot of individuals make money trading commodity futures by trading spreads to minimize their risks. Covered calls stock options trades are spreads.
Gold and other commodity futures markets tend to move in reaction to what is happening in currencies, bond and stock markets.
Commodities are weak hedges against inflation, recessions, wars and political turmoil. They wax and wane as traders turn bullish or bearish for whatever reasons. Because the markets, like many others are subject to manipulation by politicians around the world and “fundamentals” are less important to speculators, commodities and currency markets are driven more by chart formations, trends and other momentum technicals.
NEM and other commercial interests in the precious metals and industrials metals markets are price takers just like commercials in the grains and other foodstuffs markets. They don’t have the pricing power of industrials like Apple Inc. (AAPL) , Caterpillar Inc. (CAT) or Deere & Co. (DE) .
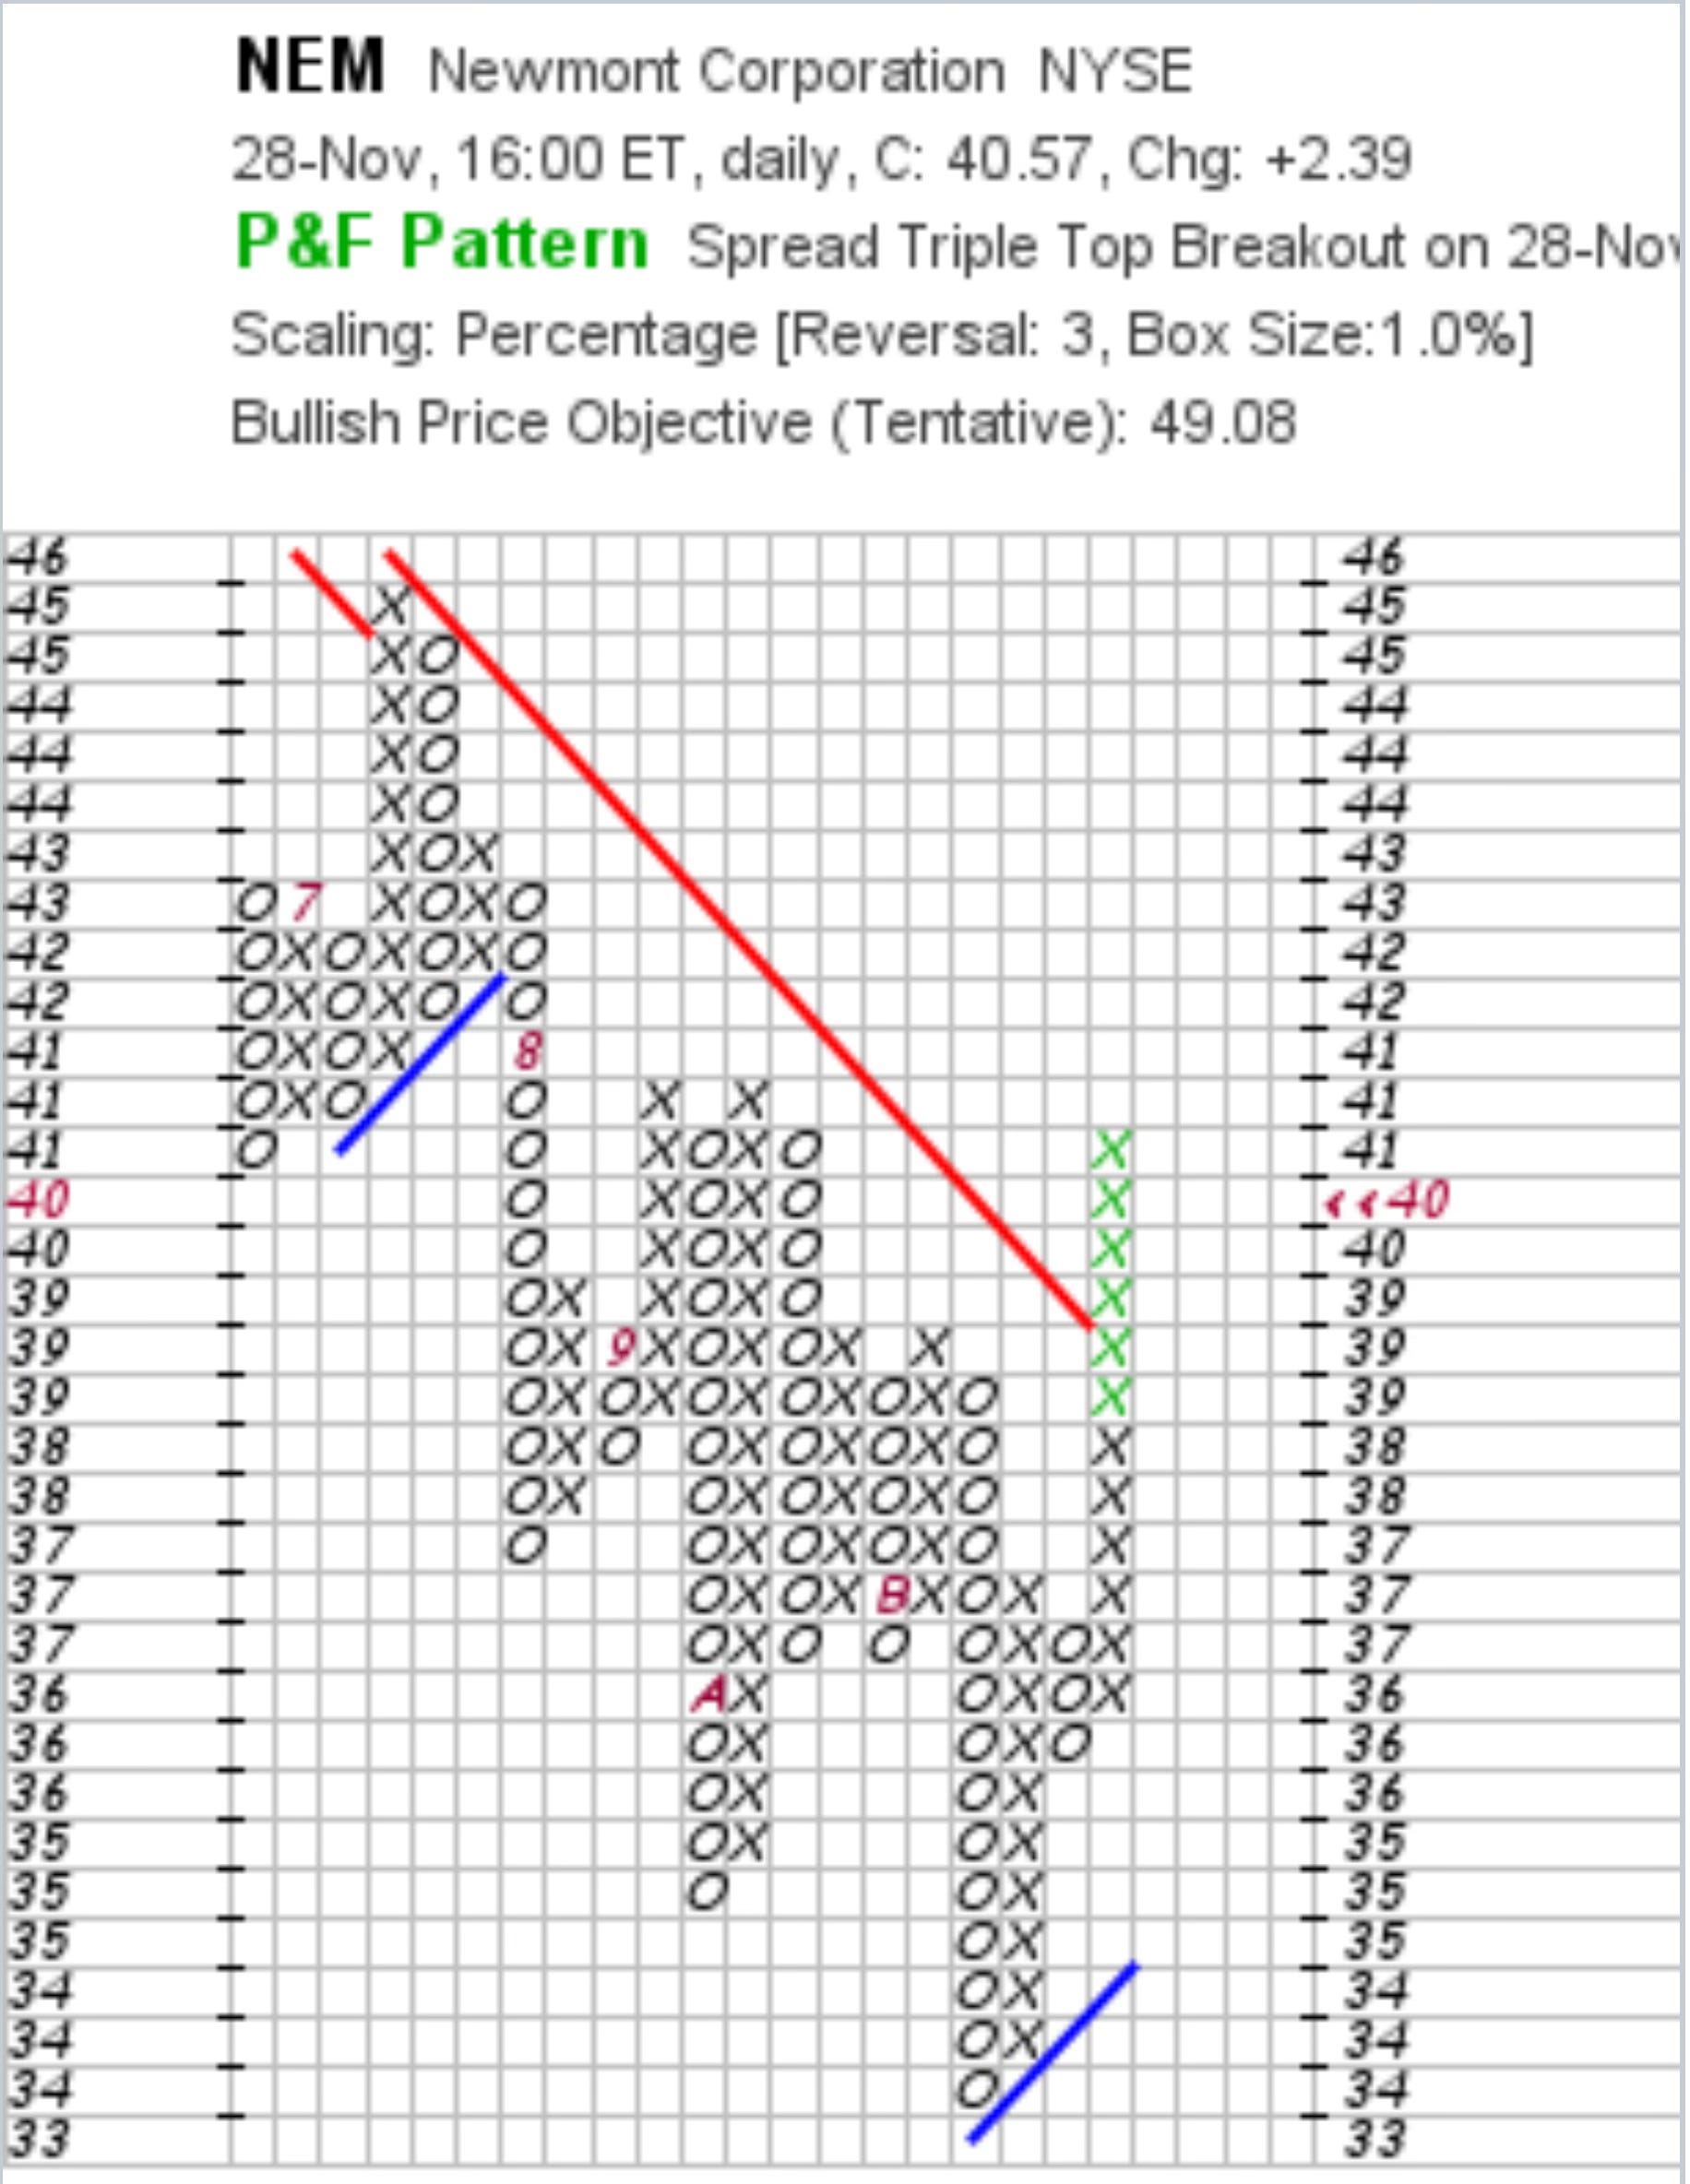
This point and figure chart from StockCharts.com shows how NEM is breaking out. NEM’s PnF price objective is $49.08, up from $47.87 yesterday after a $2.39 gain yesterday.
This morning I felt a bit lucky. Yesterday I watched NEM close well above my $40 strike price on my NEM 12.15.23 $40 covered calls position. I thought that at $40.57, NEM would be called at my $40 covered calls strike by traders seeking to capture NEM’s $0.40 dividend when it went ex-dividend on Tuesday.
One reason my NEM wasn’t called may be because traders know that after a stock goes ex-dividend, it is likely to drop the amount of the dividend unless it is so bullish that it continues to rise regardless of the dividend.
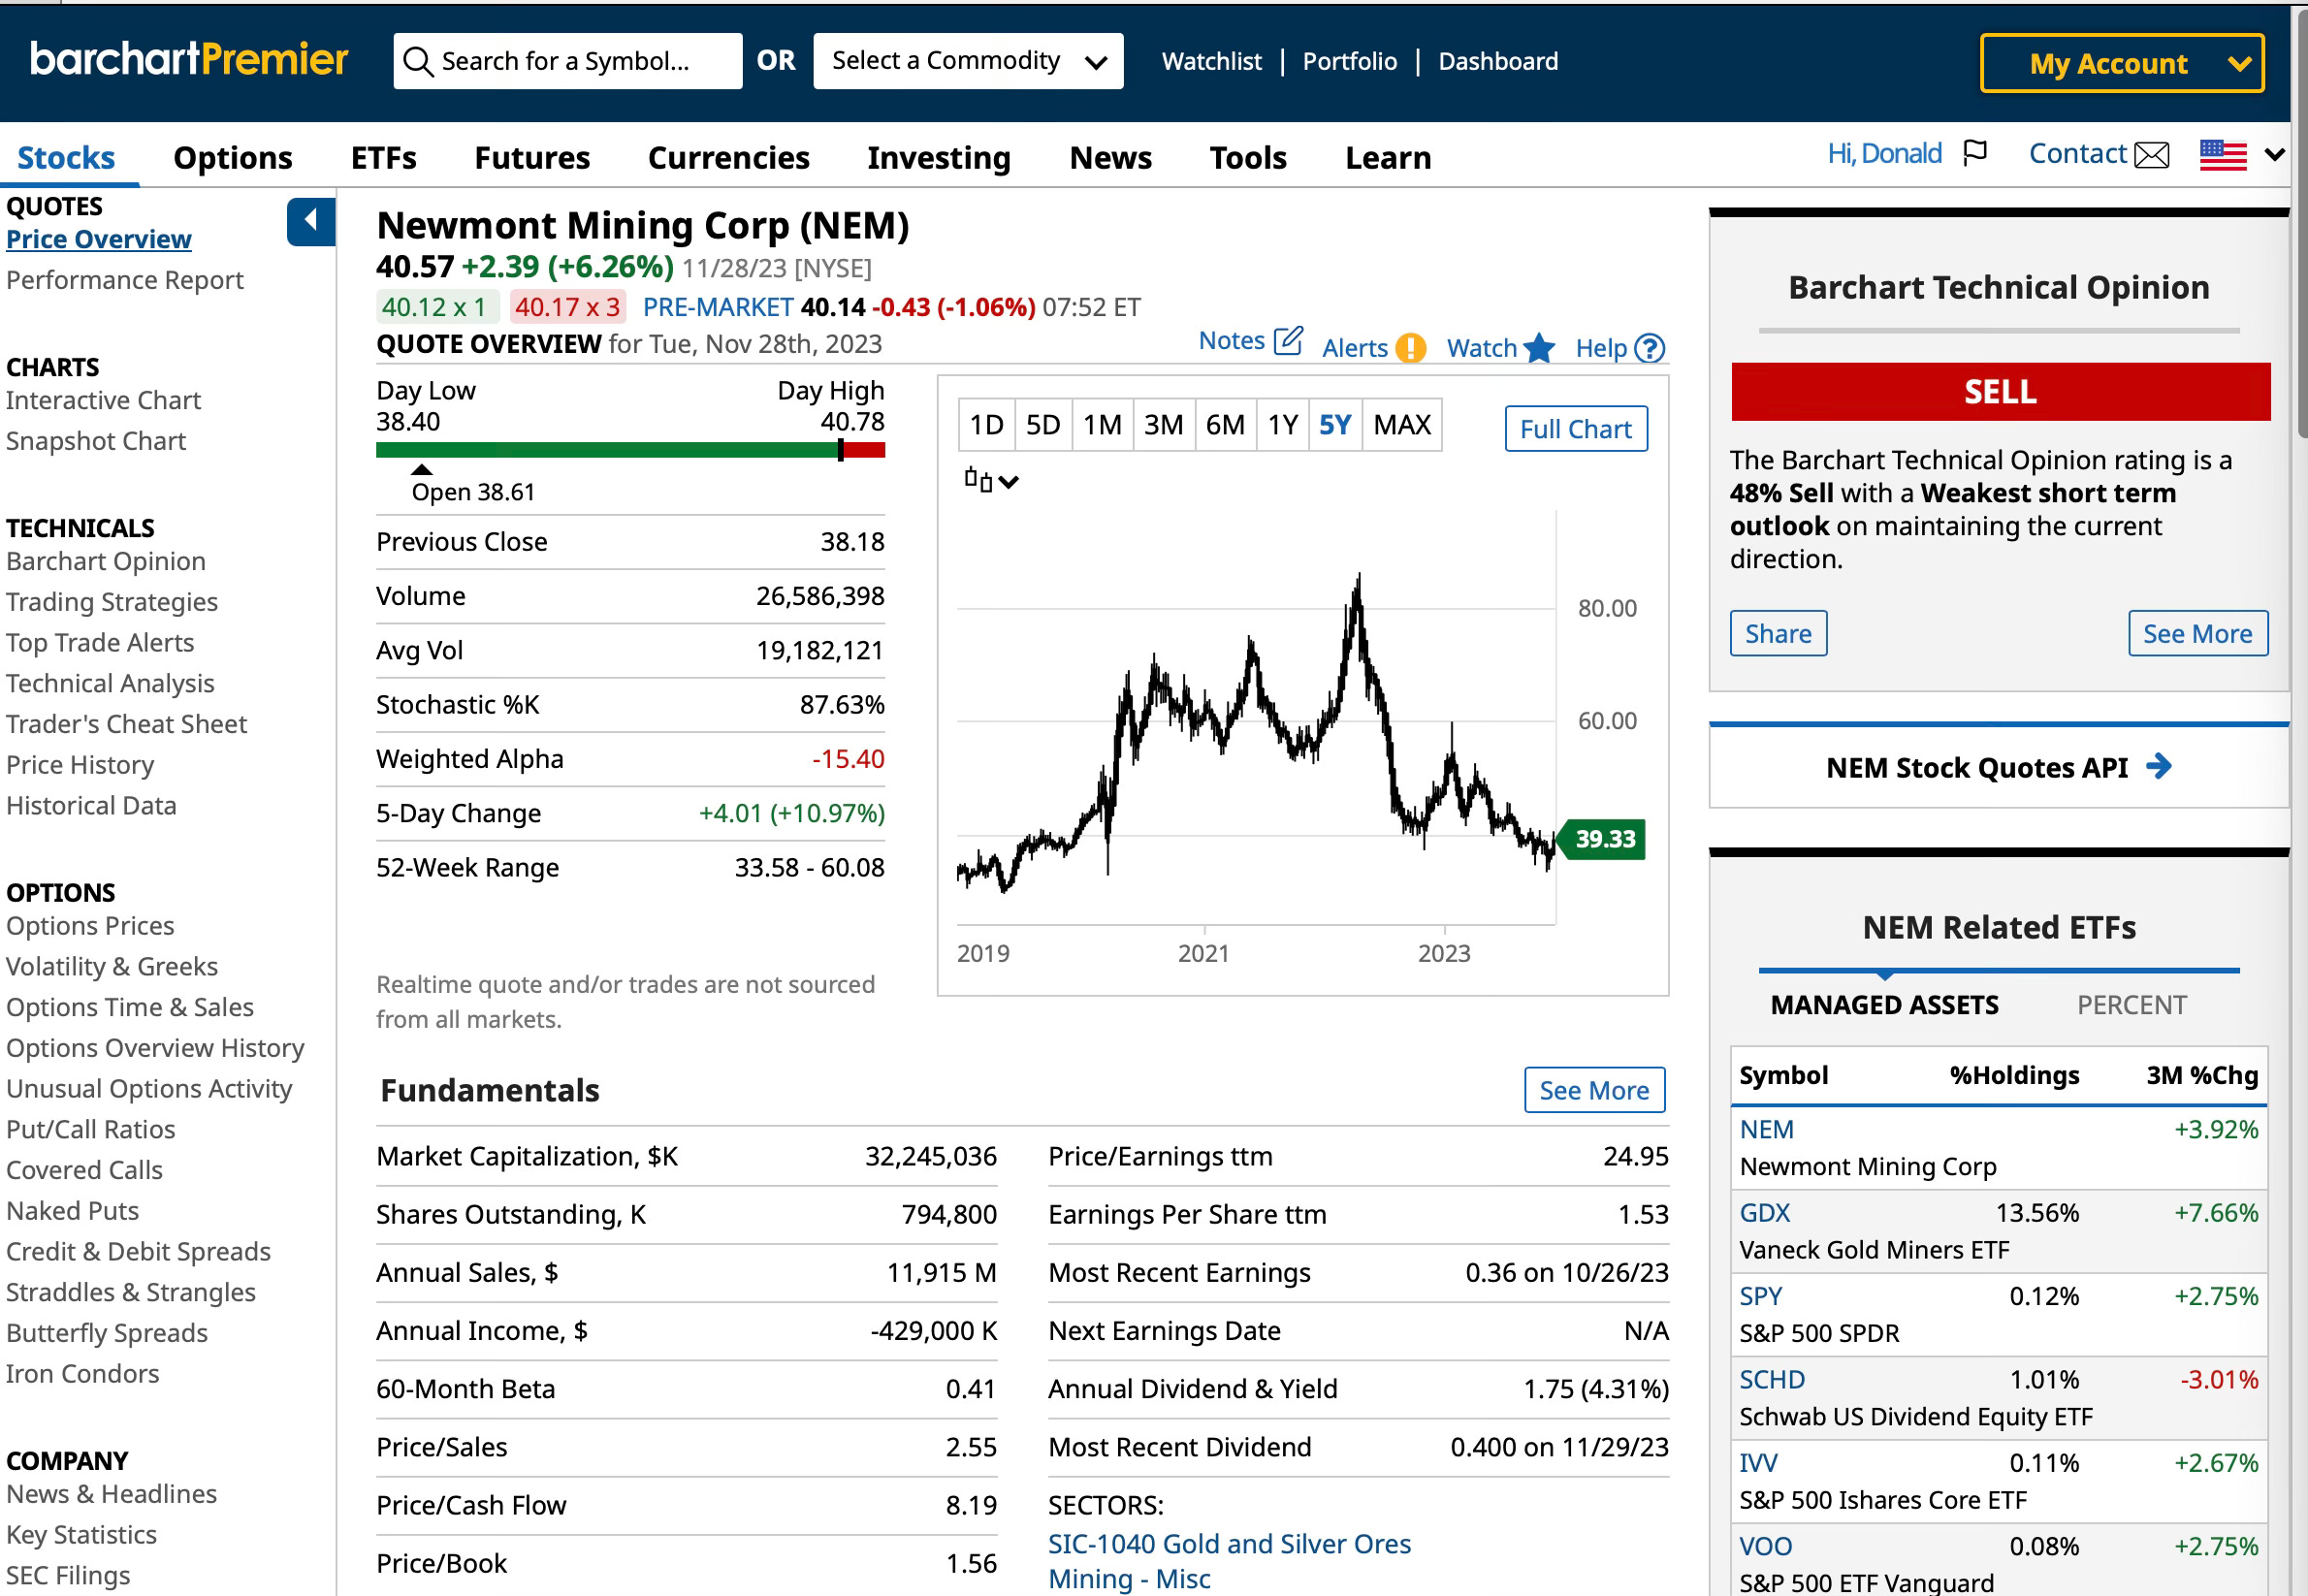
Also, despite NEM’s recent rally, 48% of the 13 momentum indicators tracked by Barchart.com are still bearish. NEM is a 48% sell, but that should change in the next few days if NEM continues to rally with gold.
More important, with NEM’s relative strength at 66.5, it’s just below the 70 RSI, the stock is close to being over bought.
While the price to cash flow ratio is a low 10.4 valuation, the price to free cash flow ratio (P/FCF) is a very high 42.1. P/FCF is the most reliable indication of value because it’s harder for companies to manipulate than price to earnings (PE) ratios. NEM’s PE is a moderately high 24.95. The forward PE is a more attractive 15.3, according to StockRover.com.
Newmont gets four stars at Morningstar.com (MORN), which estimates NEM’s fair value is $53. StockRover.com’s NEM FVE is a low $33.02. Valuentum.com’s FVE is $40 with a $26 to $54 range of estimates based on various scenarios of what might happened to the economy and the stock. FVE estimates differ because analysts use different economic, free cash flow and discount rates in their models.
Wall Street analyst tend to be more optimistic than investors. At the moment, the highest target price for NEM posted by an analyst is $67 a share. The mean target price is $53.50 and the low target price is $38.
I don’t have a target price because I think the markets and the PnF and other technicals are the best indicators of price trends. Individuals can’t predict stock prices, interest rates or events that drive prices.
While I don’t trade commodity futures, which I covered daily and weekly for trade and business newspapers for about a dozen years back in the 1960s and 1970s, I’ve been in and out of NEM and its covered calls and puts for years.
I want to be in the gold market by owning the leading gold miner.
Rather than pay mutual funds or exchange traded funds that charge management fees when you own them, I prefer to be in good dividend stocks like NEM. It is yielding about 4.3% on its current price of $40.17 at this writing.
So far this year, I’ve done 13 NEM cash secured puts trades and 7 NEM covered calls trades in an IRA account.
Puts premiums have lowered the net debit by $1.578 per share on my NEM holdings. Covered calls lowered the net debit by $5.046 a share, collected dividends by $2.960 a share and capital gains on called covered calls trades lowered the net debit by $0.72.
At this point, assuming my NEM 12.15.23 $40 strike calls are exercised, my NEM net debit is $28.807. If NEM is not called, the net debit will be $29.807 per share.
What my NEM trades show is that trading NEM through its low and high prices while collecting capital gains and dividends can generate a lot more income (more than 26% annualized) than the average annual 7% to 8% gain in stocks over the years.
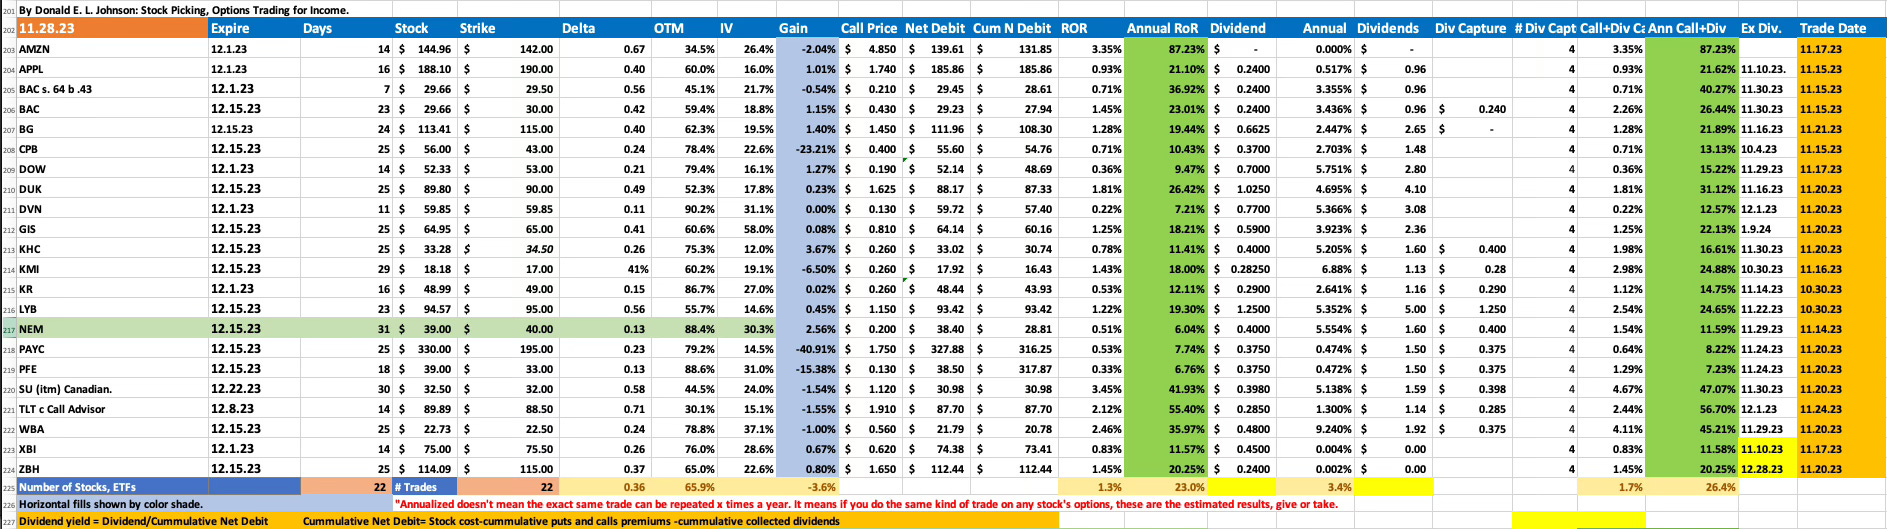
On Nov. 14, when NEM was at $36.13, I sold NEM 12.15.23 (31 days) $40 strike (delta .13, out of the money probability 88.4%, implied volatility 30.3%) covered calls for $0.20 a share, or a 6.04% annual return on risk. ARoR assumes I can get a 0.51% RoR every month during the next 12 months on NEM or other stocks.
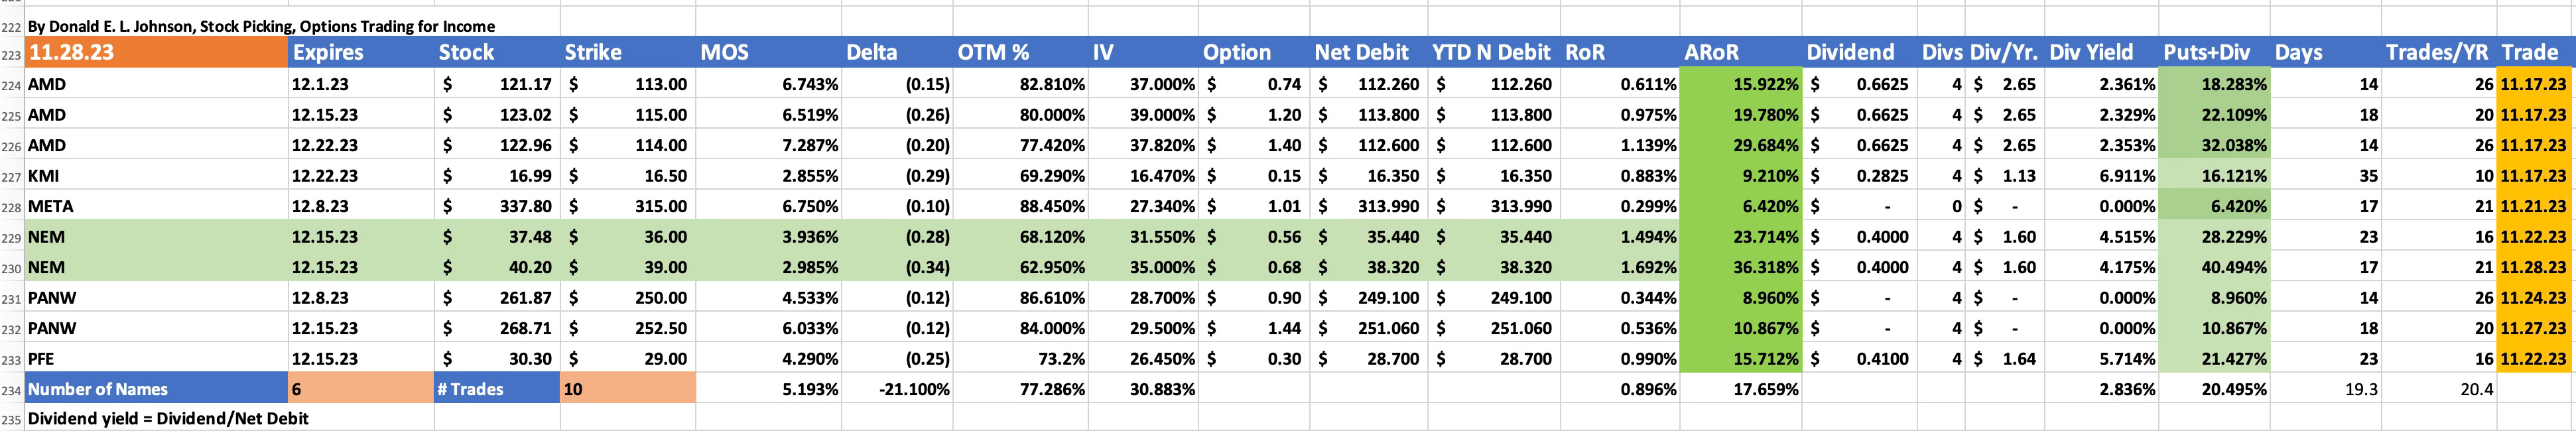
On Nov. 22 I saw an opportunity to sell NEM 12.15.23 (23 days) $36 strike (delta -.28, OTM probability 68.12%, IV 31.55%) cash and stock secured puts for $0.56 a share. That gave me a 3.936% margin of safety, or discount if the stock is assigned, which seems unlikely now. The ROR was 1.494%, or an ARoR of 23.714% if I could match that trade 16 times in the next 12 months.
Yesterday, Nov. 28, when NEM was at $40.20, it looked like my NEM would be called.
I decided to try to buy it back at a lower price than the $40 I would get if it was called. That is why I sold NEM 12.15.23 (17 days) $39 strike (MOS 2.985%) delta -.34, OTM 62.95% and IV 38.32%) cash and stock secured puts. If NEM closes below $39 on Dec. 15 it will be assigned or sold to me for $39 and double my position in the stock. The RoR on this trade was 1.69%, or a 36.318% ARoR.
The risk of selling covered calls stock options is that the stock will sink well below the strike price or as might be the case with NEM, the stock price will soar above the strike price. The risk of selling cash secured puts is that the stock will fall well below the strike price. That will mean that the stock is assigned at, say $39 when it is at $35, give or take. Options trading like investing in stocks or commodity futures involves taking risks.
The risk can be minimized by buying back puts and covered calls at a loss before they are assigned.
I respond to comments on the comments section where readers’ comments are posted. That is, if you have a question about this article or other comments, I'll discuss your questions with you in the comments section below this article.
Thanks for reading Stock Picking, Options Trading for Income! Subscribe for free to receive new posts and support my work.
LINKs:
Home Page. See my more than 190 articles on options trading, stock picking and watch lists. If you read several of these articles, you’ll learn how my strategies are meant to work. No guarantees. Links to useful web sites are on the lower right corner of the home page. Scroll down.
Follow @RealDonJohnson on twitter.com and FaceBook.com. Or follow me on Substack.com/Notes where my byline is my handle.
How To Pick 12 Good Stocks For 2024 Covered Calls, Cash Secured Puts Trades
15 December Covered Calls Trades Yielding 22.9% to 26.2%
12 Berkshire Hathaway Buys For Covered Calls Options Traders
20 November 2023 Covered Calls Trades Yielding 13.3% to15.9% Update #2
AMZN, META, MSFT And NVDA Posted Big Gains. November Puts Trades Update #4
5 Bullish Stocks For Covered Calls, Puts Stock Options Trades
How I'm Trading Amazon Covered Calls, Cash Secured Puts Stock Options For Options Premium Income
9 December 2023 Cash Secured Puts Stock Options Trades Yield 15.6%
22 November 2023 Covered Calls Trades Yield 12.9% to 15.3%
31 November 2023 Cash Secured Puts Trades Yield 10.3% Update #5
25 November 2023 Cash Secured Puts Trades Update #3
20 November 2023 Cash Secured Puts Trades Update #2
10 November 2023 Cash Secured Puts Trades Update #1
5 November 2O23 Cash Secured Puts Options Trades
10 November 2023 Covered Calls Trades Update #1
7 November 2023 Covered Calls Trades Are Yielding 13.3%
Selling in The Money Covered Calls Can Yield Big Annual Returns on Risk. By Donald E. L. Johnson
How to Beat Inflation Tax, Bear Market Tax With Dividend Stocks, Covered Calls, Cash Secured Puts, by Donald E. L. Johnson.
How I Analyze Bullish Puts Options Trades With Stock Rover, By Donald E. L. Johnson.
Wars Breed Inflation, Rising Interest Rates, Market Turmoil, By Donald E. L. Johnson.
Calls vs Puts Options: What’s the Difference?
A video on how to place options trades on TDAmeritrade.com’s Think or Swim trading platform.
On the date of publication, Donald E.L. Johnson had a position in: AAPL, NEM. All information and data in this article is solely for informational purposes. For more information please view the Barchart Disclosure Policy here.
