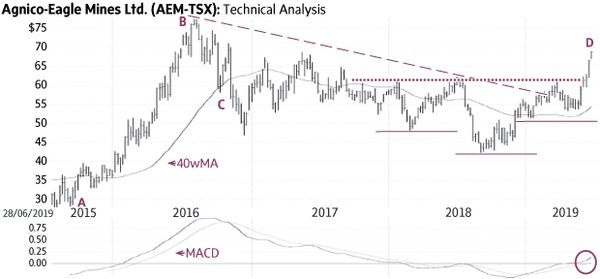
Agnico Eagle Mines Ltd. (Friday’s close $67.14) rallied from $27.63 in mid-2015 to $78.35 in mid-2016 (A-B). It reversed the rising trend when it fell below its 40-week Moving Average (40wMA – C) and started a new down-trend (dashed line). The stock remained below the downward pressure of the falling trend-line from mid-2016 to the end of 2018.
Agnico Eagle Mines built a bullish technical pattern in the form of an Inverse Head-and-Shoulder (solid lines); the recent rise above the neckline of this formation (dotted line) signalled the breakout from the bullish formation (D).
A minor correction toward ±$60 may occur but only a sustained decline below $53-54 would be negative.
Point & Figure measurements provide an initial target of $74. Higher targets are visible.
Monica Rizk is the senior Technical Analyst and Ron Meisels is the president of Phases & Cycles Inc. (www.phases-cycles.com). And he tweets at @Ronsbriefs. They may hold shares in companies profiled.
?
Chart source: www.decisionplus.com
 Monica Rizk
 Ron Meisels