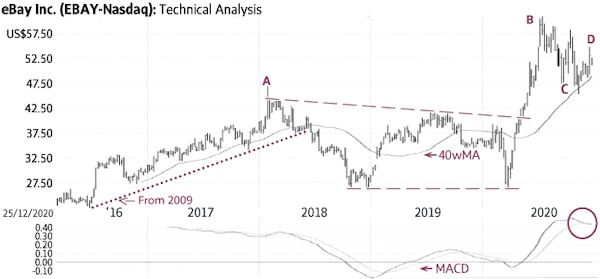
eBay (Thursday’s close US$50.12) has been in a major up-trend since 2009 (not shown). The stock reached a high of US$46.99 in February 2018 (A) then started a corrective pattern in the shape of a “wedge” for about two years (dashed lines).
Earlier this year, eBay had a major breakout from this wedge to reach a high of US$61.06 where it became extremely overbought and was far above its rising 40-week Moving Average (40wMA – B). Subsequently, it had a minor correction toward its Average where it found good support (C) and now appears to be resuming the up-trend (D).
There is good support near US$46-US$47; only a sustained decline below this level would be negative.
Point & Figure measurements provide targets of US$64 and US$69. The large wedge pattern (dashed lines) supports higher targets.
stock
Monica Rizk is the senior Technical Analyst and Ron Meisels is the president of Phases & Cycles Inc. (www.phases-cycles.com). And he tweets at @Ronsbriefs. They may hold shares in companies profiled.
Chart source: www.decisionplus.com
Be smart with your money. Get the latest investing insights delivered right to your inbox three times a week, with the Globe Investor newsletter. Sign up today.
 Monica Rizk
 Ron Meisels