EURJPY Elliott Wave Analysis: How to Ride the Bullish Wave
Hello traders. Welcome to this technical blog post where we will delve into the (EURJPY) currency pair. By the end of this post, you should have a clearer understanding of the path EURJPY Elliott wave analysis is following and how you can participate in the upcoming significant movement on this pair. So, please join me on this journey.
If you've been keeping up with us on any of our social media platforms or reading our blog posts, you've likely come across our bullish outlook for Yen pairs, as illustrated in our posts, charts, or videos. We cover a total of 78 instruments, including 7 Yen pairs, among which EURJPY is included.
EURJPY Elliott Wave Analysis - 25th April Weekly Chart Update

Above is the weekly chart we shared with members on 04.25.2024, illustrating a long-term bullish sequence on EURJPY. The chart depicts a super cycle degree impulse wave pattern that initiated in June 2016, following the conclusion of the grand super cycle degree wave ((II)). Consequently, we find ourselves in wave ((III)) of the super cycle degree, with the current position being within wave (III) of the super cycle degree. Looking further, we're currently in wave III of (III) of ((III)). Based on this analysis, the long-term trend strongly favors the upside.
EURJPY Elliott Wave Analysis - 25th April Daily Chart Update
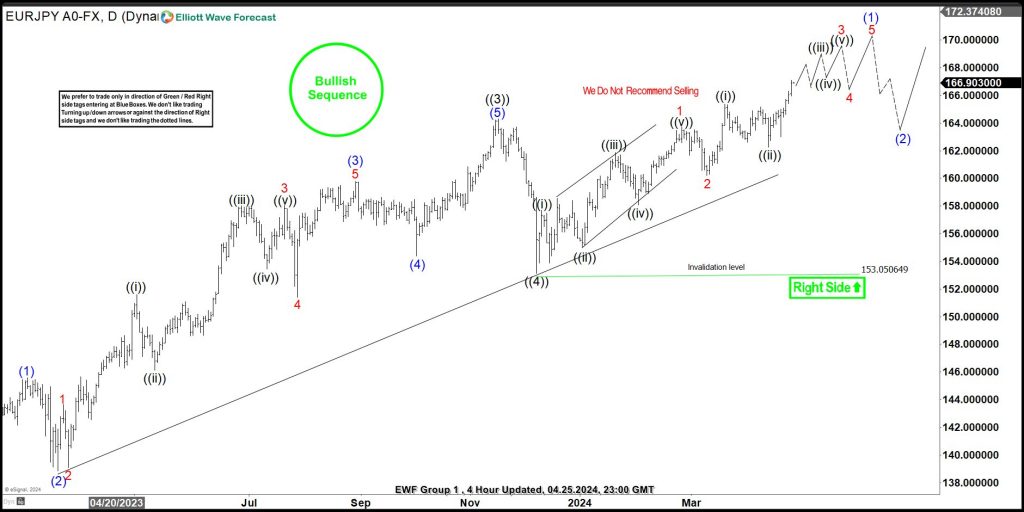
Now, let's examine the EURJPY daily chart as of the close of the trading day on 04.25.2024. The chart above illustrates the sub-waves of wave III. Wave II of (III) concluded at the low in August 2022, and we're now in III of (III). Additionally, wave III is in its 5th wave - wave ((5)) of III. However, wave ((5)) may have considerable room to ascend before completion, currently progressing in wave (1) of ((5)), which commenced in December 2023. Therefore, throughout 2024 thus far, we've maintained a bullish stance on EURJPY. Within wave (1) of ((5)), we've been scouting for opportunities to buy pullbacks in 3, 7, or 11 swings, such as the following setup shared with members on 04.13.2024
EURJPY Elliott Wave Analysis - 13th April H4 Update
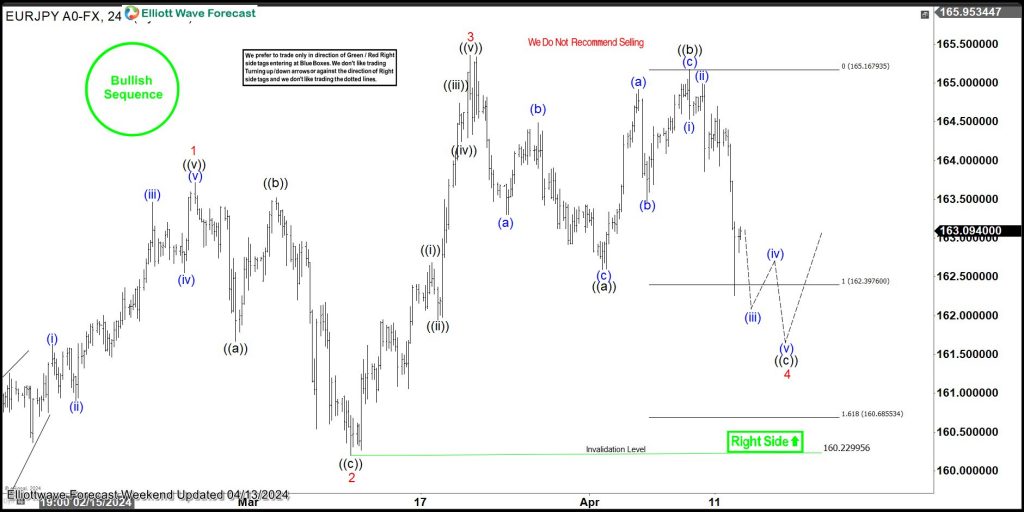
On 04.13.2024, we shared the H4 chart above with group 1 members. We expected wave 4 of (1) to end between 162.397-160.685 before starting an upward move to finish wave 5 of (1) in a diagonal pattern. As predicted, the price action matched our expectations. The rally we anticipated began right at the upper limit of the extreme zone, hitting 162.24 precisely.
EURJPY Elliott Wave Analysis - 26th April H4 Update
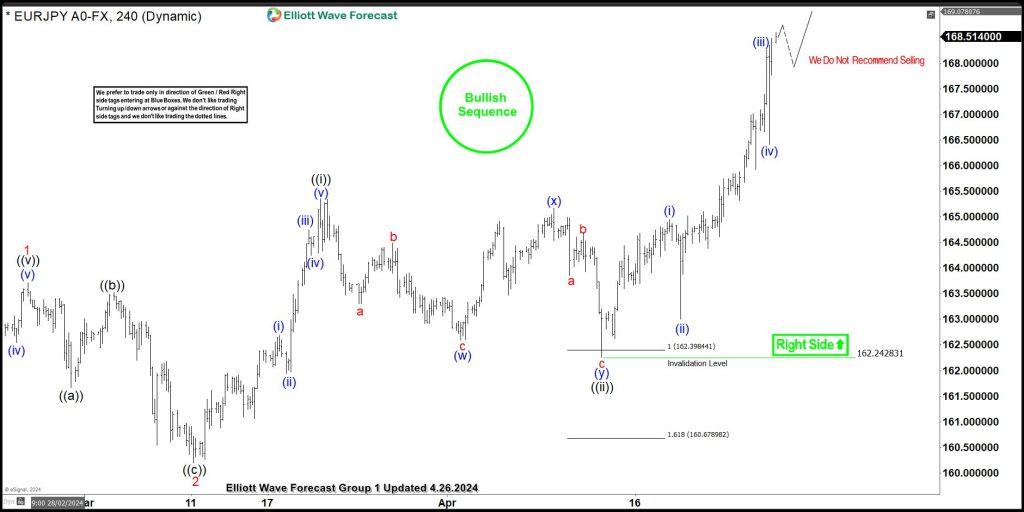
The subsequent H4 chart above, shared with members on 04.25.2024, reveals EURJPY's advancement from 162.24 with an impulse. Though the H4 wave count has been adjusted to align with current price action, the outcome remains consistent to the upside. Presently, price is in wave (v) of ((iii)) of 3 of (1). With the long-term, medium-term, and short-term bullish sequences remaining intact, there is still considerable upside potential. Moving forward, our strategy remains unchanged. While we disregard selling, we will continue to seek LONG opportunities in pullbacks that conclude within the extreme zone.
Source: https://elliottwave-forecast.com/forex/eurjpy-elliott-wave-analysis-ride-bullish-wave/
On the date of publication, Elliott Wave Forecast did not have (either directly or indirectly) positions in any of the securities mentioned in this article. All information and data in this article is solely for informational purposes. For more information please view the Barchart Disclosure Policy here.

