Crude Oil Is Trapped In A Triangle Range
Crude is recovering from end of 2023, ideally forming a corrective rise within downtrend, therefore we are tracking wave (B) correction that can be either a bearish triangle pattern, or larger zig-zag correction that can retest 100 resistance area, if a triangle turns into a bullish one.

www.wavetraders.com
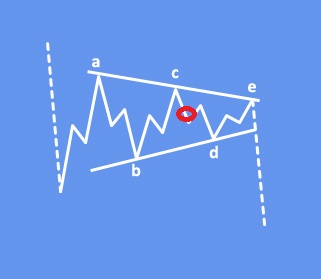
A triangle appears to reflect a balance of forces, causing a sideways movement that is usually associated with decreasing volume and volatility. The triangle pattern contains five overlapping waves that subdivide 3-3-3-3-3 and are labeled A-B-C-D-E. The running triangle is a region of horizontal price movement, a consolidation of a prior move, and it is composed of “threes.” That means each of the A-B-C-D-E waves have three subwaves. The triangle pattern is generally categorized as a continuation pattern, meaning that after the pattern completes, it’s assumed that the price will continue in the trend direction it was moving before the pattern appeared. Keep in mind that triangles can be tricky sometimes and we may see a break in other direction first before a trend continution, so it’s important to wait on confirmations. Triangles indicate that the final leg is coming before a reversal and that’s why triangles are labeled in wave B, wave X or wave 4.
On the date of publication, Gregor Horvat did not have (either directly or indirectly) positions in any of the securities mentioned in this article. All information and data in this article is solely for informational purposes. For more information please view the Barchart Disclosure Policy here.

