LFL, Canada's Largest Home Retailer, Releases Record Revenue for the Year Ended December 31, 2022
Toronto, Ontario--(Newsfile Corp. - February 22, 2023) - Leon's Furniture Limited (TSX: LNF) ("LFL" or the "Company"), today announced financial results for the year ended December 31, 2022.
Financial Highlights - year ended December 31, 2022
- Achieved another $2.5 billion revenue year, maintaining record results despite our challenging economic environment.
- Total system-wide sales were $3.1 billion and remained comparable to the year ended 2021, however as compared to the pre-pandemic year ended 2019, the Company's total system-wide sales have increased $324.4 million or 11.9%.
- The Company achieved gross profit margin of 44.06% compared to 44.10% in the prior year, which was attained while significantly lowering on-hand levels of inventory during the last three months of the year.
- eCommerce sales were $245 million in the year, which represents 9.7% of the Company's sales and continues to run well above pre-pandemic levels.
- Achieved adjusted diluted earnings per share of $2.60 which is similar to last year.
- On a pre-pandemic basis, the adjusted diluted earnings per share increased from $1.30 for the year ended December 31, 2019, to $2.60 in the current year, representing an increase of 100%.
- Given that the COVID-19 pandemic has altered economic conditions over recent years, a five-year review of the Company's historical financial performance is more meaningful to illustrate the Company's results.
5 Year Financial Performance of LFL
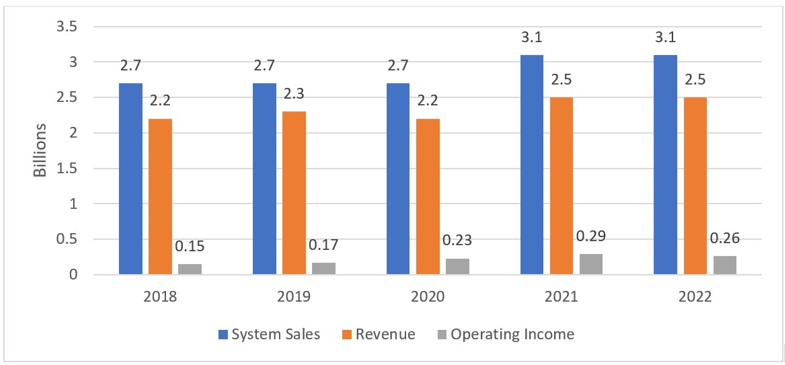
Cannot view this image? Visit:
https://images.newsfilecorp.com/files/4576/155610_chart1.jpg
Financial Highlights - Q4-2022
- Total system sales achieved in the quarter were $804.4 million compared to $820.5 million in Q4-2021. However, when comparing to the pre-pandemic quarter ended December 31, 2019, total system sales has increased $53.1 million or 7.1%.
- Achieved revenue of $661.2 million in Q4-2022 in comparison to $669.8 million in Q4-2021.
- Same store sales(1) decreased 1.0% to $646.0 million, in comparison to Q4-2021.
Mike Walsh, President and CEO of LFL commented, "During 2022, our LFL team continued to execute in a progressively more challenging macro and customer environment. For the year, we generated $3.1 billion in total system-wide sales and $2.60 in adjusted diluted earnings per share, both similar to the record results of 2021, which benefitted from COVID-related spending growth primarily focused on the home. During Q4, we strategically reduced on-hand inventory in order to position the Company for 2023. Effective promotion and product mix resulted in an inventory reduction of approximately $91 million during the fourth quarter, with a gross margin that was 73 basis points lower than what we reported in Q4 of 2021.
Mr. Walsh continued, "Our Company was built upon environments like this. With dominant national scale, coast -to-coast integration, Canada's most recognized retail banners and related online properties, our team has all the tools at its disposal to continue generating growth and profitability for shareholders. We see plenty of opportunity to leverage our scale into additional revenue. Our recent agreement with Resident, the largest direct-to-consumer mattress company in North America, to offer Nectar and DreamCloud mattresses both online and in-store at Leon's and The Brick, is one example of this. For 2023, we will remain focused on growing the top line in the context of the market, maintaining gross margins within a reasonable range and executing on our multi-year efficiency program to drive profitability. We believe we are entering 2023 on solid footing, positioned to gain share as retail sales in general continue to disproportionately feel pressure in the current market environment."
Summary financial highlights for the three months ended December 31, 2022 and December 31, 2021
| ||||||||||||||||||||||||||||||||||||||||||||||||||||||||||||||||||||||||||||||||||||||||||||||||||||||||||||||||||||||||||||||||||||||||||||||||||||||||||||||||||||||||||||||||||||||||||||||||||||||||||||||||||||||||||||||||||||||||||||||||||||||||||||||||||||||||||||||||||||||||||||||||||||||||||||||||||||||||||||||||||||||||||||||||||||||||||||||||||||||||||||||||||||||||||||||||||||||||||||||||||||||||
(1) Refer to the non-IFRS financial measures section for additional information.
(2) Selling, general and administrative expenses ("SG&A").
Same Store Sales (1)
| For the | Three months ended | ||||||||||
| (C$ in millions, except %) | December 31, 2022 | December 31, 2021 | $ | Decrease | % Decrease | ||||||
| Same store sales (1) | 646.0 | 652.4 | (6.4 | ) | (1.0%) | ||||||
(1) Refer to the supplementary financial measures section for additional information.
Historical Same Store Sales (1) as previously reported based on comparable quarters
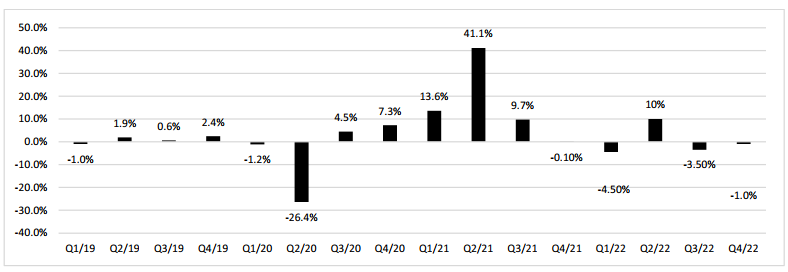
To view an enhanced version of this graphic, please visit:
https://images.newsfilecorp.com/files/4576/155610_chart2.jpg
Revenue
For the three months ended December 31, 2022, revenue was $661.2 million compared to $669.8 million in the fourth quarter 2021. Revenue decreased $8.6 million or 1.3% as compared to the prior year quarter. The current quarter compares favorably to the Company's historical results before the COVID pandemic began in the early part of the 2020 fiscal year. The Company is continuing to show increases across all product categories for the three months ended December 31, 2022, when compared to pre-pandemic results. Comparing to pre-pandemic quarter ended December 31, 2019, revenue has increased by $39.8 million or 6.4%.
Same Store Sales (1)
Same store sales in the quarter decreased by 1.0% compared to the fourth quarter 2021.
Gross Profit
The gross profit margin of 43.57% in the quarter decreased by 73 basis points from the fourth quarter 2021. This decrease in gross margin percentage during the quarter was due to a concerted effort to significantly lower on-hand inventory levels. The change in inventory levels from the start of the fourth quarter to the end of the fourth quarter, saw the Company's on-hand inventory balance decrease by over $91 million or a reduction of 18.1%. This reduction in the Company's inventory balances was important given that ocean freight costs were stabilizing and are beginning to return to pre-pandemic pricing levels.
Selling, General and Administrative Expenses ("SG&A")
The Company's SG&A as a percentage of revenue for the fourth quarter 2021 was 32.64% compared to 33.74% for the fourth quarter of 2022, an increase of 110 basis points over the fourth quarter 2021. The Company's SG&A as a percentage of revenue for the current quarter increased due to continued broad based inflation, the increased cost of retail financing due to the Bank of Canada interest rate increases and the increased costs of marketing in the quarter.
Adjusted Net Income (2) and Adjusted Diluted Earnings Per Share (2)
Given the combined impact in the fourth quarter of a reduced gross margin percentage and slightly higher SG&A expenses, the adjusted net income in the current quarter totaled $44.6 million, which represents a decrease of $12.4 million over the prior year's quarter.
The adjusted diluted earnings per share in the fourth quarter was $0.67 per share, a decrease of 9.5% over the prior year's quarter.
Net Income and Diluted Earnings Per Share
Net income for the fourth quarter of 2022 was $43.2 million, or $0.65 per diluted earnings per share as compared to the net income of $56.5 million in the prior year's quarter, or $0.73 per diluted earnings per share.
(1) Supplementary financial measure. Refer to section 14 in this MD&A for additional information.
(2) Non-IFRS financial measure. Refer to section 14 in this MD&A for additional information.
Summary financial highlights for the year ended December 31, 2022 and December 31, 2021
| For the | Year ended | ||||||||||
| (C$ in millions except %, share and per share amounts) | 2022 | 2021 | $ Increase (Decrease) | % Increase (Decrease) | 2021 | 2020 | | $ Increase (Decrease) | | % Increase (Decrease) | |
| Total system-wide sales (1) | 3,053.0 | 3,057.6 | (4.6) | (0.2%) | 3,057.6 | 2,701.6 | 356.0 | 13.2% | |||
| Franchise sales (1) | 535.3 | 544.9 | (9.6) | (1.8%) | 544.9 | 481.4 | 63.5 | 13.2% | |||
| Revenue | 2,517.7 | 2,512.7 | 5.0 | 0.2% | 2,512.7 | 2,220.2 | 292.5 | 13.2% | |||
| Cost of sales | 1,408.2 | 1,404.4 | 3.8 | 0.3% | 1,404.4 | 1,236.3 | 168.1 | 13.6% | |||
| Gross profit | 1,109.4 | 1,108.2 | 1.2 | 0.1% | 1,108.2 | 983.9 | 124.3 | 12.6% | |||
| Gross profit margin as a percentage of revenue | 44.06% | 44.10% | 44.10% | 44.32% | |||||||
| Selling, general and administrative expenses (2) | 854.7 | 819.1 | 35.6 | 4.3% | 819.1 | 751.0 | 68.1 | 9.1% | |||
| SG&A as a percentage of revenue | 33.95% | 32.60% | 32.60% | 33.83% | |||||||
| Income before net finance costs and income tax expense | 254.7 | 289.1 | (34.4) | (11.9%) | 289.1 | 233.0 | 56.1 | 24.1% | |||
| Net finance costs | (21.5) | (15.0) | 6.5 | 43.3% | (15.0) | (17.9) | (2.9) | (16.2%) | |||
| Income before income taxes | 233.2 | 274.1 | (40.9) | (14.9%) | 274.1 | 215.1 | 59.0 | 27.4% | |||
| Income tax expense | 56.0 | 68.7 | (12.7) | (18.5%) | 68.7 | 48.4 | 20.3 | 41.9% | |||
| Adjusted net income (1) | 177.2 | 205.5 | (28.3) | (13.8%) | 205.5 | 166.7 | 38.8 | 23.3% | |||
| Adjusted net income as a percentage of revenue (1) | 7.04% | 8.18% | 8.18% | 7.51% | |||||||
| | |||||||||||
| After-tax mark-to-market gain on financial derivative instruments (1) | (2.2) | (1.7) | (0.5) | 29.4% | (1.7) | 3.4 | (5.1) | (150.0%) | |||
| Net income | 179.4 | 207.2 | (27.8) | (13.4%) | 207.2 | 163.3 | 43.9 | 26.9% | |||
| Basic weighted average number of common share | 67,512,284 | 77,623,382 | 77,623,382 | 79,798,908 | |||||||
| Basic earnings per share | $2.66 | $2.67 | $(0.01) | (0.4%) | $2.67 | $2.05 | $0.62 | 30.2% | |||
| Adjusted basic earnings per share (1) | $2.62 | $2.65 | $(0.03) | (1.1%) | $2.65 | $2.09 | $0.56 | 26.8% | |||
| Diluted weighted average number of common shares | 68,164,937 | 79,062,376 | 79,062,376 | 82,113,879 | |||||||
| Diluted earnings per share | $2.64 | $2.62 | $0.02 | 0.8% | $2.62 | $1.99 | $0.63 | 31.7% | |||
| Adjusted diluted earnings per share (1) | $2.60 | $2.60 | $0.00 | 0.0% | $2.60 | $2.04 | $0.56 | 27.5% | |||
| Common share dividends declared (3) | $0.64 | $1.89 | $(1.25) | (66.1%) | $1.89 | $0.88 | $1.01 | 114.8% | |||
| Convertible, non-voting shares dividends declared | $0.32 | $0.32 | $0.00 | 0.0% | $0.32 | $0.29 | $0.03 | 10.3% | |||
(1) Refer to the non-IFRS financial measures section for additional information.
(2) Selling, general and administrative expenses ("SG&A").
(3) $1.25 special dividend included in the 2021 amount of $1.89.
Same Store Sales (1)
| For the | Year ended | ||||||||||
| (C$ in millions, except %) | December 31, 2022 | December 31, 2021 | $ | Decrease | % Decrease | ||||||
| Same store sales (1) | 2,453.1 | 2,454.1 | (1.0) | (0.0%) | |||||||
(1) Refer to the supplementary financial measures section for additional information.
Revenue
For the year ended December 31, 2022, revenue was $2,517.7 million compared to $2,512.7 million in the prior year, an increase of $5.0 million or 0.2% as compared to the prior year. This increase was primarily due to strong performance in the mattress category. This year the Company has continued to produce record top-line results when comparing to pre-pandemic top-line results. Revenue has increased approximately $234 million or 10.3% compared to the year ended December 31, 2019, which was due to sales growth across all product categories.
Same Store Sales (1)
Same store corporate sales remained comparable to the year ended December 31, 2021.
Gross Profit
The gross profit margin remained comparable from 44.10% for the year ended December 31, 2021, to 44.06% in the year ended December 31, 2022. This decrease in gross margin percentage during the year was due to a concerted effort to significantly lower on-hand inventory levels, especially during the fourth quarter of the 2022 fiscal year. Additionally, this marginal decrease in gross profit percentage was also due to increases in cost of sales in the furniture product category due to the increased ocean freight and overland transportation costs of landing product in the earlier part of the 2022 fiscal year. When comparing the Company's pre-pandemic gross profit margin, it increased 33 basis points as compared to the same period in 2019. This resulted from the Company monitoring product costing to control the release and flow of offshore containers due to the abovementioned increased freight costs in the latter half of 2021 and the first half of 2022.
Selling, General and Administrative Expenses
The Company's SG&A as a percentage of revenue for the year ended December 31, 2022, increased to 33.95%, an increase of 135 basis points over the prior year of 32.60%. This increase can be primarily attributed to provincially mandated wage increases, the increased costs of providing customers with retail financing options at the point of sale both in-store and online, increases in sales commissions and marketing costs and rising occupancy expenses due to increases of natural gas prices net of any previously provided COVID mandated property tax and utility rebates.
Adjusted Net Income (2) and Adjusted Diluted Earnings Per Share (2)
Adjusted net income for the year ended December 31, 2022, totaled $177.2 million, a decrease of $28.3 million or 13.8% over the prior year. In comparison to the year ended December 31, 2019, which the Company has denoted as its pre-pandemic baseline year, the Company's adjusted net income significantly increased by 65.9%, or $70.4 million.
Adjusted diluted earnings per share for the Company remained the same at $2.60 per share compared to the year ended December 31, 2021.
However, when looking at the historical performance of the Company on a pre-pandemic basis, the adjusted diluted earnings per share increased from $1.30 for the year ended December 31, 2019, to $2.60 in the current year, representing an increase of 100%.
Net Income and Diluted Earnings Per Share
Including the mark-to-market impact of the Company's financial derivatives, net income for the year ended December 31, 2022, was $179.4 million, or $2.64 per diluted earnings per share (net income of $207.2 million, $2.62 per diluted earnings per share in 2021).
(1) Supplementary financial measure. Refer to section 14 in this MD&A for additional information.
(2) Non-IFRS financial measure. Refer to section 14 in this MD&A for additional information.
Dividends
As previously announced, the Company paid a quarterly dividend of $0.16 per common share on 9th day of January 2023. Today the Directors have declared a quarterly dividend of $0.16 per common share payable on the 6th day of April 2023 to shareholders of record at the close of business on the 6th day of March 2023. As of 2007, dividends paid by Leon's Furniture Limited are "eligible dividends" pursuant to the changes to the Income Tax Act under Bill C-28, Canada.
Outlook
Given the Company's strong and continuously improving financial position, our principal objective is to increase our market share and profitability. We remain focused on our commitment to effectively manage our costs but to also continuously invest in digital innovation that we believe will drive more customers to both our online eCommerce sites and our 304 store locations across Canada.
Non-IFRS Financial Measures
The Company uses financial measures that do not have standardized meaning under IFRS and may not be comparable to similar measures presented by other entities. The Company calculates the non-IFRS financial measures by adjusting certain IFRS measures for specific items the Company believes are significant, but not reflective of underlying operations in the period, as detailed below:
| Non-IFRS Measure | IFRS Measure |
| Adjusted net income | Net income |
| Adjusted income before income taxes | Income before income taxes |
| Adjusted earnings per share - basic | Earnings per share - basic |
| Adjusted earnings per share - diluted | Earnings per share - diluted |
| Adjusted EBITDA | Net income |
Adjusted Net Income
The Company calculates comparable measures by excluding the effect of changes in fair value of derivative instruments, related to the net effect of USD-denominated forward contracts. The Company uses derivative instruments to manage its financial risk in accordance with the Company's corporate treasury policy. Management believes excluding from income the effect of these mark-to-market valuations and changes thereto, until settlement, better aligns the intent and financial effect of these contracts with the underlying cash flows.
Adjusted EBITDA
Adjusted earnings before interest, income taxes, depreciation and amortization, mark-to-market adjustment due to the changes in the fair value of the Company's financial derivative instruments and any non-recurring charges to income ("Adjusted EBITDA") is a non-IFRS financial measure used by the Company. The Company considers adjusted EBITDA to be an effective measure of profitability on an operational basis and is commonly regarded as an indirect measure of operating cash flow, a significant indicator of success for many businesses. Adjusted EBITDA is a non-IFRS financial measure used by the Company. The Company's Adjusted EBITDA may not be comparable to the Adjusted EBITDA measure of other companies, but in management's view appropriately reflects the Company's specific financial condition. This measure is not intended to replace net income, which, as determined in accordance with IFRS, is an indicator of operating performance.
The following is a reconciliation of reported net income to adjusted EBITDA:
| For the | Three months ended | Year ended | |||||||||
| (C$ in millions) | December 31, 2022 | December 31, 2021 | December 31, 2022 | December 31, 2021 | |||||||
| Net income | 43.2 | 56.5 | 179.4 | 207.2 | |||||||
| Income tax expense | 13.9 | 17.9 | 56.8 | 69.2 | |||||||
| Net finance costs | 6.0 | 2.9 | 21.5 | 15.0 | |||||||
| Depreciation and amortization | 27.1 | 27.7 | 110.0 | 112.0 | |||||||
| Mark-to-market (gain)/loss on financial derivative instruments | 1.9 | 0.7 | (3.0) | (2.2) | |||||||
| Adjusted EBITDA | 92.1 | 105.7 | 364.7 | 401.2 | |||||||
Total System Wide Sales
Total system wide sales refer to the aggregation of revenue recognized in the Company's consolidated financial statements plus the franchise sales occurring at franchise stores to their customers which are not included in the revenue figure presented in the Company's consolidated financial statements. Total system wide sales is not a measure recognized by IFRS and does not have a standardized meaning prescribed by IFRS, but it is a key indicator used by the Company to measure performance against prior period results. Therefore, total system wide sales as discussed in this MD&A may not be comparable to similar measures presented by other issuers. We believe that disclosing this measure is meaningful to investors because it serves as an indicator of the strength of the Company's overall store network, which ultimately impacts financial performance.
Franchise Sales
Franchise sales figures refer to sales occurring at franchise stores to their customers which are not included in the revenue figures presented in the Company's consolidated financial statements, or in the same store sales figures in this MD&A. Franchise sales is not a measure recognized by IFRS, and does not have a standardized meaning prescribed by IFRS, but it is a key indicator used by the Company to measure performance against prior period results. Therefore, franchise sales as discussed in this MD&A may not be comparable to similar measures presented by other issuers. Once again, we believe that disclosing this measure is meaningful to investors because it serves as an indicator of the strength of the Company's brands, which ultimately impacts financial performance.
Supplementary Financial Measures
The Company uses supplementary financial measures to disclose financial measures that are not (a) presented in the financial statements and (b) is, or is intended to be, disclosed periodically to depict the historical or expected future financial performance, financial position or cash flow, that is not a non-IFRS financial measure as detailed above.
Same Store Sales
Same store sales are defined as sales generated by stores, both in store and through online transactions, that have been open for more than 12 months on a fiscal basis. Same store sales as discussed in this MD&A may not be comparable to similar measures presented by other issuers, however this measure is commonly used in the retail industry. We believe that disclosing this measure is meaningful to investors because it enables them to better understand the level of growth of our business.
About Leon's Furniture Limited
Leon's Furniture Limited is the largest retailer of furniture, appliances and electronics in Canada. Our retail banners include: Leon's; The Brick; Brick Outlet; and The Brick Mattress Store. Finally, with The Brick's Midnorthern Appliance banner alongside with Leon's Appliance Canada banner, this makes the Company the country's largest commercial retailer of appliances to builders, developers, hotels and property management companies. The Company has 304 retail stores from coast to coast in Canada under various banners. The Company operates six websites: leons.ca, thebrick.com, furniture.ca, midnothern.com, transglobalservice.com and appliancecanada.com.
Cautionary Statement
This press release may contain forward-looking statements that are subject to known and unknown risks and uncertainties that could cause actual results to vary materially from targeted results. Such risks and uncertainties include those described in Leon's Furniture Limited's periodic reports including the annual report or in the filings made by Leon's Furniture Limited from time to time with securities regulatory authorities.
This News Release may include certain "forward-looking statements" which are not comprised of historical facts. Forward-looking statements include estimates and statements that describe the Company's future plans, objectives or goals, including words to the effect that the Company or management expects a stated condition or result to occur. Forward-looking statements may be identified by such terms as "believes", "anticipates", "expects", "estimates", "may", "could", "would", "will", or "plan". Since forward-looking statements are based on assumptions and address future events and conditions, by their very nature they involve inherent risks and uncertainties. Although these statements are based on information currently available to the Company, the Company provides no assurance that actual results will meet management's expectations. Risks, uncertainties and other factors involved with forward-looking information could cause actual events, results, performance, prospects and opportunities to differ materially from those expressed or implied by such forward-looking information. Forward-looking information in this news release includes, but is not limited to, the Company's objectives, goals or future plans, and estimates of market conditions. Factors that could cause actual results to differ materially from such forward-looking information include, but are not limited to failure to identify beneficial business opportunities, failure to convert the potential in the pursued business opportunities to tangible benefits to the Company or its shareholders, the ability of the Company to counteract the potential impact of the COVID-19 coronavirus on factors relevant to the Company's business, delays in obtaining or failures to obtain required shareholder and TSX approvals, changes in equity markets, inflation, changes in exchange rates, fluctuations in commodity prices, delays in the development of projects, and those risks set out in the Company's public documents filed on SEDAR. Although the Company believes that the assumptions and factors used in preparing the forward-looking information in this news release are reasonable, undue reliance should not be placed on such information, which only applies as of the date of this news release, and no assurance can be given that such events will occur in the disclosed time frames or at all. The Company disclaims any intention or obligation to update or revise any forward-looking information, whether as a result of new information, future events or otherwise, other than as required by law.
For further information, please contact:
Constantine Pefanis
Chief Financial Officer
Leon's Furniture Limited
Tel: (416) 243-4073
lflgroup.ca
Jonathan Ross
LodeRock Advisors, Leon's Investor Relations
jon.ross@loderockadvisors.com
Tel: (416) 283-0178
![]()
To view the source version of this press release, please visit https://www.newsfilecorp.com/release/155610
