Canada's labour force is increasingly reliant on well-educated immigrants who are enjoying employment rates that are broadly in line with the national average.
The latest findings of the 2016 census provide an in-depth look at the national labour market, offering valuable data for government decision makers as well as Canadians looking to match their skills with jobs that are in demand.
It also shows that Canada has the highest proportion of college graduates among developed nations, partly because recent immigrants are especially well-educated. The percentage of all immigrants with a master's or doctorate degree is twice that of the Canadian-born population.
The detailed look at Canada's workforce comes as the federal government continues to increase annual immigration levels. Ottawa and the provinces have also adopted polices in recent years aimed at boosting education levels and improving workforce participation among under-represented groups and the census information suggests progress is being made toward many of those goals.
But the numbers also point to reasons for concern. Employment rates for youth and Indigenous Canadians have declined. Meanwhile, the most common occupations in Canada – jobs like retail salesperson and truck driver – are among those most likely to be put at risk due to automation.
From 2006 to 2016, the national employment rate fell from 62.6 per cent to 60.2 per cent. The data points to a variety of factors, including lower oil prices, an increase in precarious work and the lingering effects of the 2008 financial crisis.
Immigration
Immigrants accounted for 23.8 per cent of the labour force in 2016, up from 21.2 per cent in 2006, because of increased immigration. The employment rate for immigrants stood at 57.3 per cent, slightly below the national average of 60.2 per cent.
Statistics Canada noted immigration is an important part of Canada's strategy for offsetting the impact of population aging, which might otherwise lead to a shrinking pool of workers and labour shortages.
Seniors
More people are working past the age of 65, especially those who do not have a company pension.
The census found that nearly one in five Canadians aged 65 and older reported working at some point in 2015, almost double the proportion from 1995. Statistics Canada said this trend can be attributed to several factors, with some seniors working by choice and others out of necessity.
"Higher employment rates [among seniors] could also be related to an increase in the debt levels of older Canadians, increased wages and more favourable employment opportunities, better health, and an increasingly service-sector oriented labour market with less manual labour," Statistics Canada said in a report released Wednesday.
Another factor was whether or not seniors had a pension plan, given that the percentage of workers covered by a pension plan has been on the decline since the 1990s. Seniors without retirement income were almost 1.5 times more likely to work after 65 than other seniors.
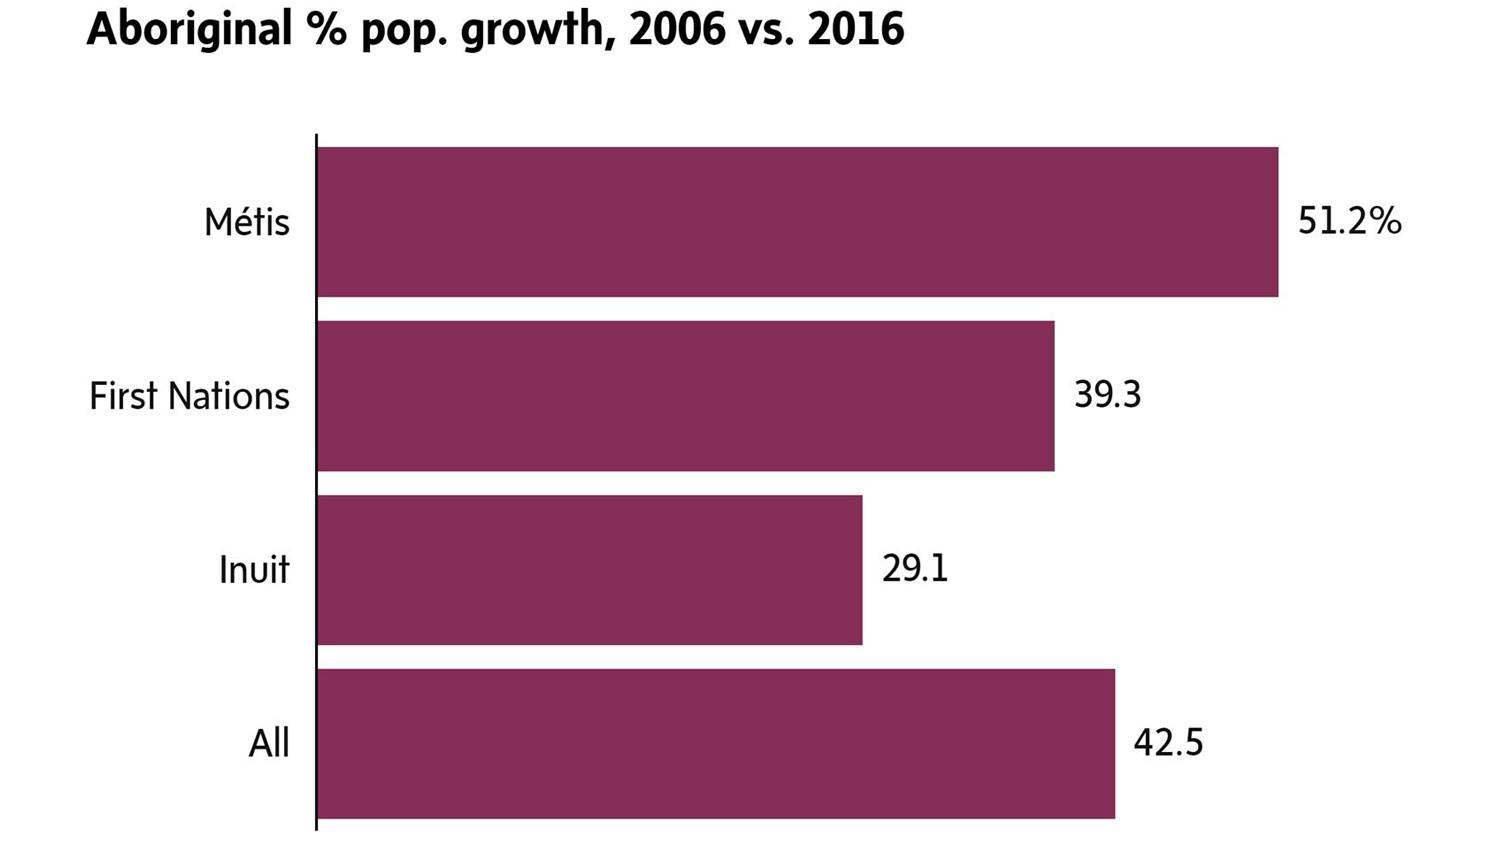
Indigenous population
Employment rates for Indigenous people aged 25 to 54 ranged from 47 per cent for First Nations people living on reserve to 74.6 per cent among Métis. Most employment rates for Indigenous people in that age group declined from 2006 to 2016.
In the last decade, Canada's Indigenous population has become much more educated. Nearly 70 per cent of Indigenous people aged 25 to 64 had completed high school in 2016, up from 60 per cent in 2006.
This positive trend continued for postsecondary education as well, with 10.9 per cent of Indigenous people getting a university degree, 23 per cent getting a college diploma and 5.6 per cent getting an apprenticeship certificate.
However, where an Indigenous person lives tends to affect how likely they are to achieve postsecondary education. For example, the percentage of off-reserve First Nations people with a bachelor's degree was 11.4 per cent – compared to 5.4 per cent of those living on reserve.
Gender

Labour participation
rate for people aged
15 to 64 years,
men vs. women
Greater
than 84%
80-84%
75-80%
72-75%
Less than
72%
Sparsely populated
THE GLOBE AND MAIL, SOURCE: STATISTICS CANADA

Labour participation
rate for people aged
15 to 64 years,
men vs. women
Greater than
84%
80% to 84%
75% to 80%
72% to 75%
Less than
72%
Sparsely populated
THE GLOBE AND MAIL, SOURCE: STATISTICS CANADA

Labour participation
rate for people aged
15 to 64 years,
men vs. women
Greater than 84%
80% to 84%
75% to 80%
72% to 75%
Less than 72%
Sparsely
populated
THE GLOBE AND MAIL, SOURCE: STATISTICS CANADA
Clear differences appear in the types of work performed by men and women, but both sexes have seen a declining proportion of full-time jobs.
In 2015, 56.2 per cent of men aged 25 to 54 worked full-time all year, down from 63.3 per cent in 2005. For core-aged women, 43.7 per cent worked full-year and full-time, down from 46.4 per cent in 2005.
Women outnumbered men four-to-one in health occupations, while men outnumbered women three-to-one in high-tech occupations.
One of the biggest changes in educational attainment among Canadians is the percentage of men (aged 25 to 34) who have earned apprenticeship certificates. In 2006, only 4.9 per cent of men in this age group earned this kind of degree, but that nearly doubled to 7.8 per cent of men in 2016. Statistics Canada attributes this shift to the strong earning potential and demand for jobs in the trades industry. For example, the median earnings for a man with this education was $72,955 in 2015, 7 per cent higher than men with college degrees and 31 per cent higher than men with high school diploma as their highest level of education.
The census also showed that men with these certificates went on to become electricians, where the median earnings were $84,016 in 2015. In Saskatchewan, men with apprenticeship certificate had higher median earnings than men with bachelor's degrees, with the group respectively earning $86,059 and $84,825 in 2015.
By comparison, the proportion of women earning apprenticeship certificates continued to remain low, hovering around 2 per cent. However, women are outpacing men when it comes to earning bachelor's degrees, with 40.7 per of women aged 25 to 34 getting a university degree compared to about 30 per cent of men in the same age group. The 2016 census also noted that one in five single mothers had earned a bachelor's degree or higher. This is up from 14.7 per cent in 2006.
In terms of fields of study, women are flocking to three main fields: education, social sciences and law, and health. Nursing was one area that was almost exclusively composed of female students – 92.7 per cent were women. And when it came to finding jobs in their field, 95.4 per cent of female nursing graduates landed a job in a related field.
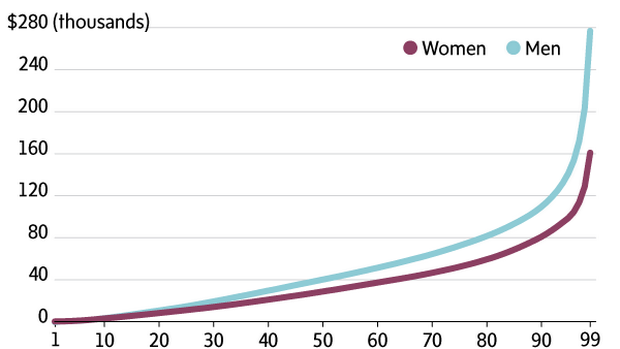
When it comes to earning potential, women are still making less than men when they have the same education qualifications. In 2015, women aged 25 to 64 with a bachelor's degree had a median annual income of $68,342 compared with men, who earned $82,082.
Commuting
Cycling and public transit are increasingly popular commuting options in Canada's largest cities, according to the 2016 census data.
Commuters spent an average of 26.2 minutes travelling one way to their workplace in 2016, up slightly from 25.4 minutes in 2011. The average commuting time was 24.1 minutes for car commuters and 44.8 minutes for public transit commuters.
The way Canadians get to work has shifted considerably over the past two decades. More people are cycling or taking public transit to work.
However, eight in 10 Canadians still get to work by car – 74 per cent by driving, plus 6 per cent who are a passenger in a car. Twelve per cent take public transit, 7 per cent walk or ride a bicycle, and 1 per cent find another way, such as taxis.
Not surprisingly, Canada's biggest cities have the most public transit users. Toronto, Montreal and Vancouver lead the nation in public transit commuting rates, followed by Ottawa-Gatineau, Calgary, Winnipeg, Edmonton and Quebec.
The median one-way commuting distance was 7.7 km in each direction.
INCOME AND MOBILITY IN CANADA: WHY IT MATTERS WHERE YOU LIVE

SNAPSHOTS OF CANADA: WHAT WE'VE LEARNED FROM THE 2016 CENSUS