NVIDIA Corp ( $NVDA) Reacted From the Blue Box Area as Expected.
Hello everyone. In today’s article, we will look at the past performance of the 1H Hour Elliott Wave chart of NVIDIA Corp (NVDA) . The rally from 5.02.2024 low at $812.70 unfolded as 5 waves impulse. So, we expected the pullback to unfold in 7 swings and find buyers again. We will explain the structure & forecast below:
7 Swings WXY correction

$NVDA 1H Elliott Wave Chart 5.9.2024:

Here is the 1H Elliott Wave count from 5.09.2024. We expected the pullback to find buyers at the blue box area at 885.16 – 865.25 in 7 swings.
$NVDA 1H Elliott Wave Chart 5.12.2024:
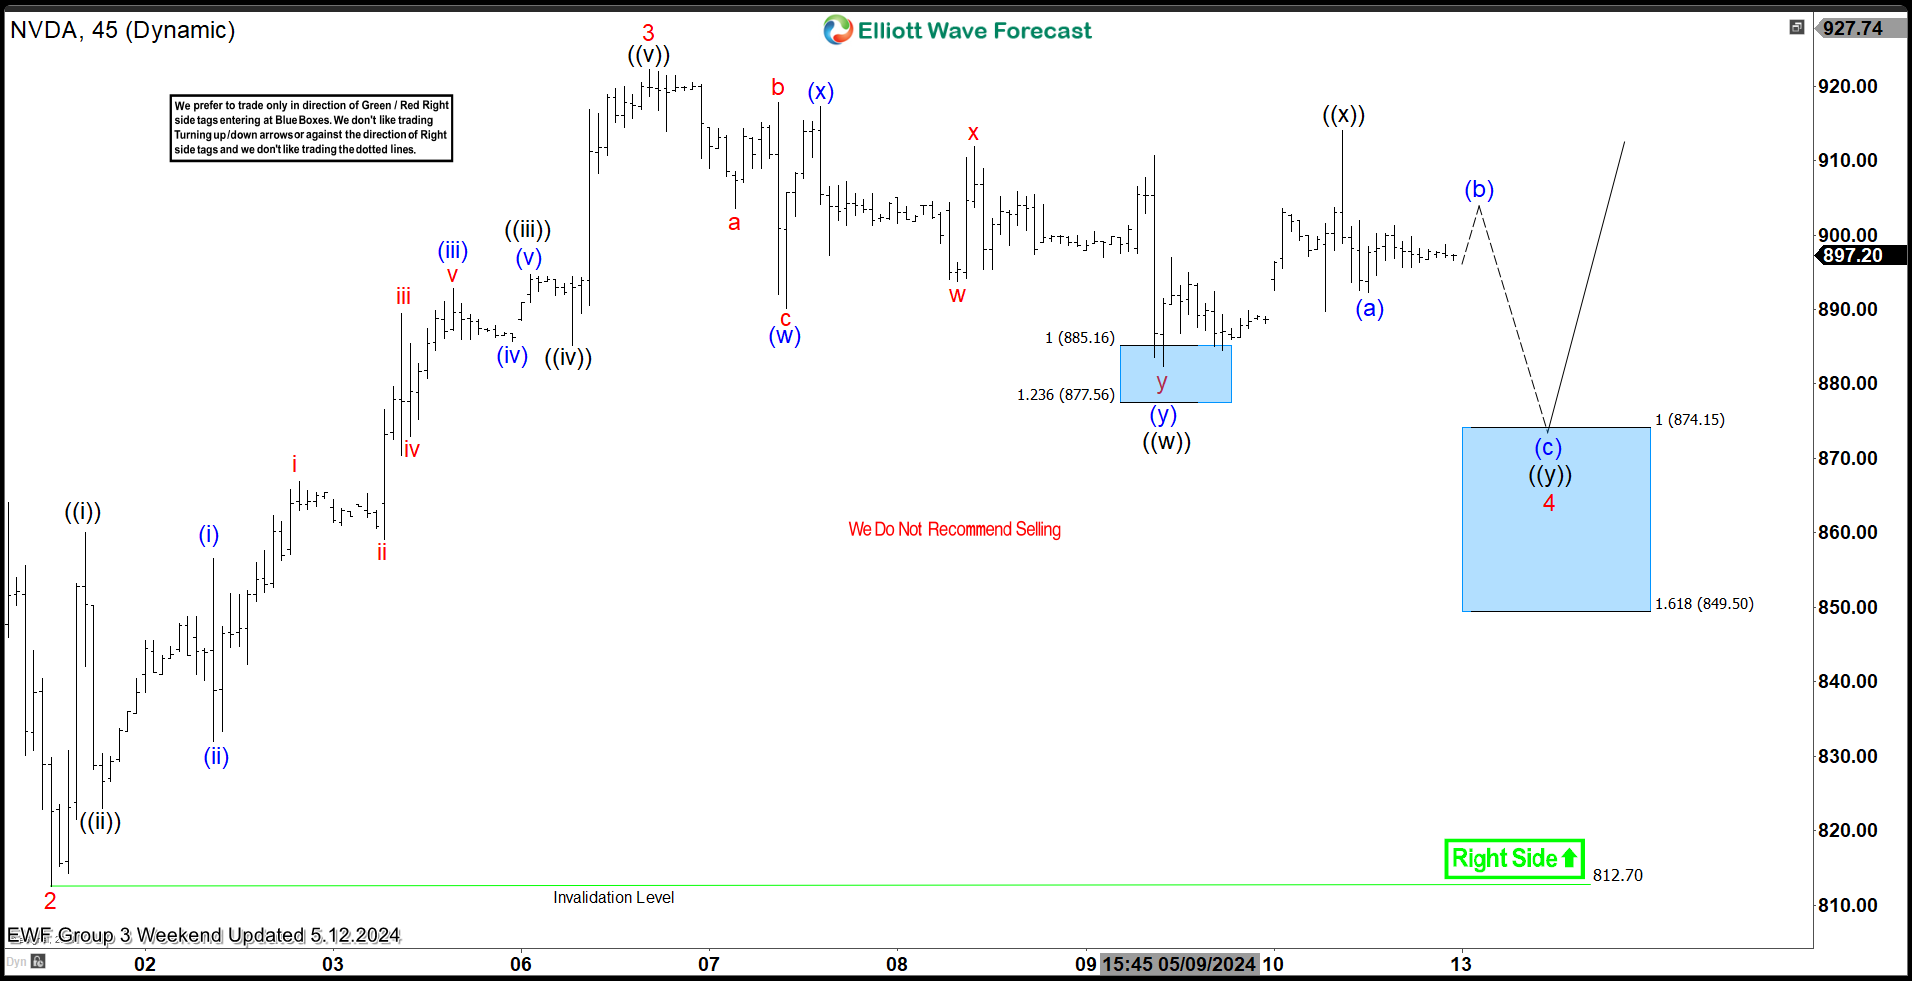
Here is the latest 1H update from 5.12.2024 showing the bounce taking place as expected. The stock has reacted higher from the blue box area allowing longs to get risk free. The stock is expected to either trade lower in a bigger double correction or remain supported with a target area towards $932 – 947 before another pullback can happen.
Source: https://elliottwave-forecast.com/stock-market/nvidia-corp-nvda-reacted-blue-box-area-expected/
On the date of publication, Elliott Wave Forecast did not have (either directly or indirectly) positions in any of the securities mentioned in this article. All information and data in this article is solely for informational purposes. For more information please view the Barchart Disclosure Policy here.

